IB DP Maths: AI SL復習筆記4.4.2 Expected Values
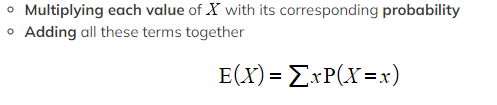
Expected Values E(X) What does E(X) mean and how do I calculate E(X)? E(X)?means the?expected value?or the?mean?of a?random variable X The expected value does not need to be an obtainable value of?...
Expected Values E(X) What does E(X) mean and how do I calculate E(X)? E(X)?means the?expected value?or the?mean?of a?random variable X The expected value does not need to be an obtainable value of?...
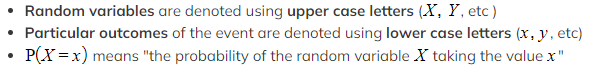
Discrete Probability Distributions What is a discrete random variable?? A?random variable?is a variable whose value depends on the outcome of a?random event The value of the random variable is not ...

Venn Diagrams What is a Venn diagram? A Venn diagram is a way to illustrate?events?from an?experiment?and are particularly useful when there is an overlap between possible?outcomes A Venn diagram c...
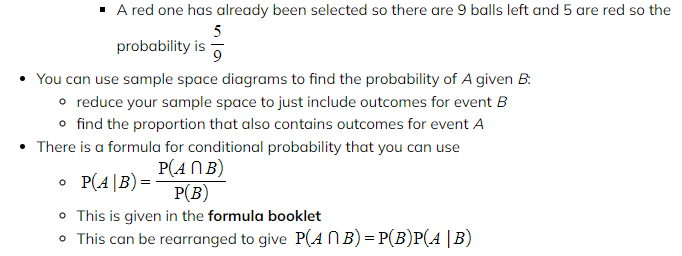
Conditional Probability What is conditional probability? Conditional?probability?is where the probability of an?event?happening can vary depending on the outcome of a prior event The event?A?happen...
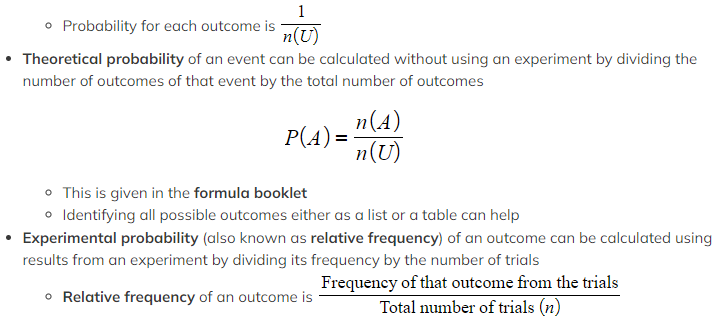
Probability Basics What key words and terminology are used with probability? An?experiment?is a repeatable activity that has a result that can be observed or recorded Trials?are what we call the re...
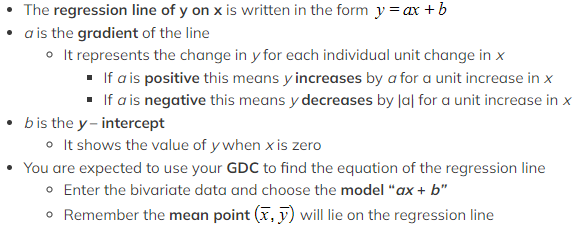
Linear Regression What is linear regression? If?strong linear correlation?exists on a scatter diagram then the data can be modelled by a?linear model Drawing lines of best fit by eye is not the bes...

PMCC What is Pearson’s product-moment correlation coefficient? Pearson’s product-moment correlation coefficient (PMCC) is a way of giving a numerical value to a?linear relationship?of bivariate dat...

Scatter Diagrams What does bivariate data mean? Bivariate data?is data which is collected on?two variables?and looks at how one of the factors affects the other Each data value from one variable wi...

Interpreting Data How do I interpret statistical measures? The?mode?is useful for?qualitative data It is not as useful for quantitative data as there is not always a unique mode The?mean includes a...


