Edexcel IGCSE Physics 復習筆記 3.2.5 Core Practical: Investigating Snell's law
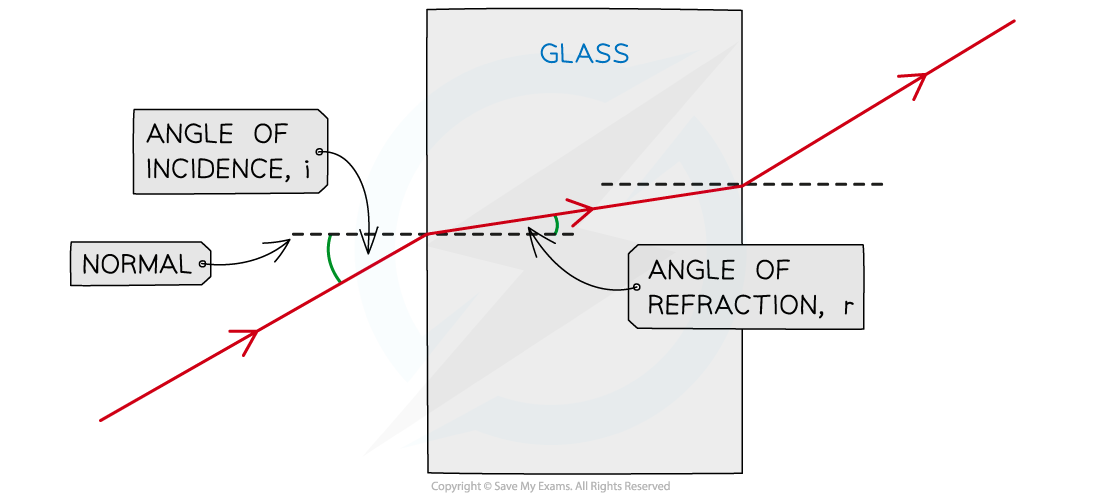
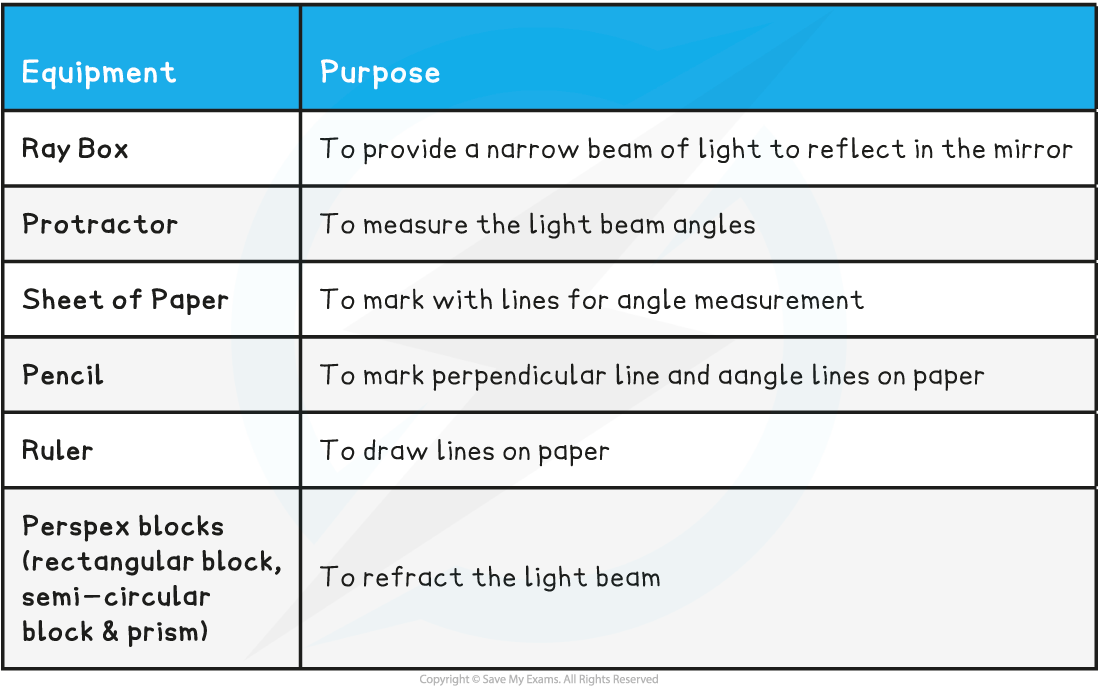
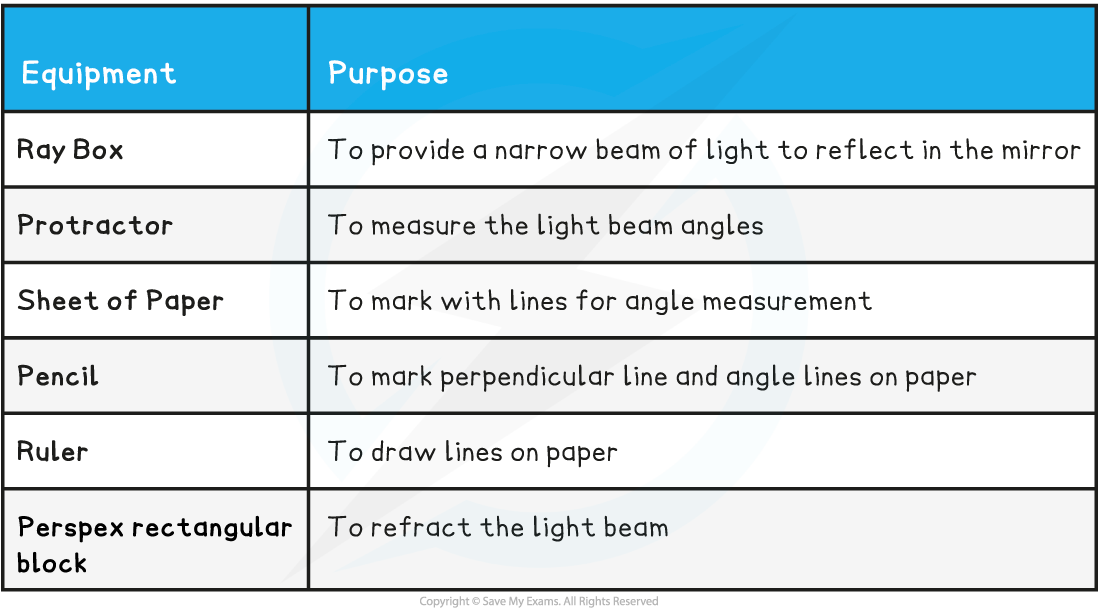
Edexcel IGCSE Physics 復習筆記 3.2.5 Core Practical: Investigating Snell's law Core Practical 5: Investigating Snell's Law Aim of the Experiment To investigate?the refractive index of glass,...