2016 AP Statistics統(tǒng)計學(xué)真題Practice Exam系列之簡答題免費(fèi)下載

歷年AP Statistics統(tǒng)計學(xué)系列
真題與答案下載? 掃碼咨詢


翰林國際教育全網(wǎng)首發(fā)
力爭超快速發(fā)布最全資料
助你在升學(xué)路上一帆風(fēng)順
為你的未來保駕護(hù)航
2016 AP Statistics Practice Exam Free-Response Questions Free Download
2016 AP統(tǒng)計學(xué)模考簡答題部分免費(fèi)下載
此套題僅Section II含有簡答題
共計1小時30分鐘,共6題
占總分50%
每道大題可能含有不同數(shù)量的小題
其中Part A建議用時1小時05分鐘,共5題,占Section II總分75%
Part B建議用時25分鐘,共1題,占Section II總分25%
可以使用圖形計算器
考試時會提供常用公式表
完整版下載鏈接見文末
部分真題預(yù)覽:
Part A: 1)Natural gas is used in some households to heat the home, to heat the water, and to cook. A utility company sent the following bar chart to a household to show the amount of natural gas, measured in therms (a unit of heat energy), that the household used last year. The chart shows the number of therms and the average monthly temperature, in degrees Fahrenheit, for each month of the year.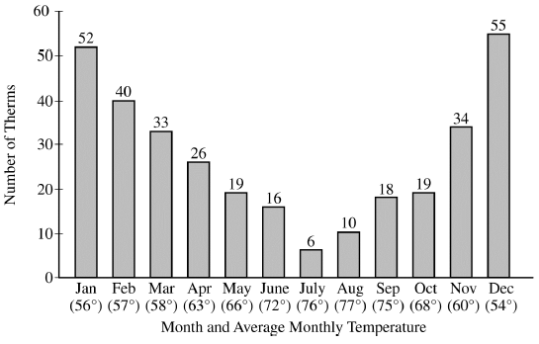
- Describe how the number of therms used each month changed over the year.
- Construct an appropriate graph that shows the relationship between the number of therms used and the average monthly temperature.

- Describe what your graph in part (b) reveals about the relationship between the number of therms used and the average monthly temperature that is not revealed on the bar chart sent by the utility company.
Part B: 6)Phone callers to a bank’s customer service center must wait until a service representative is available to answer the phone call. The bank manager is interested in estimating the mean customer wait time. Thirteen calls were selected at random. A histogram of the 13 wait times, in minutes, is shown below.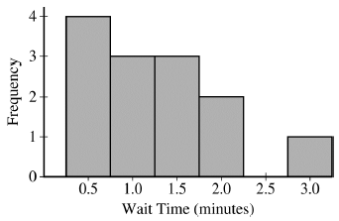
- Based on the histogram, explain why it might not be appropriate to use a one-sample t-interval to estimate the mean wait time for all customers.
A logarithmic transformation is often used to transform data such as wait times. Let x represent a customer’s wait time. The log transformation of the customer’s wait time is given by
log10 x . The table below shows the original 13 wait times, the respective log-transformed wait times, and the corresponding means, medians, and standard deviations.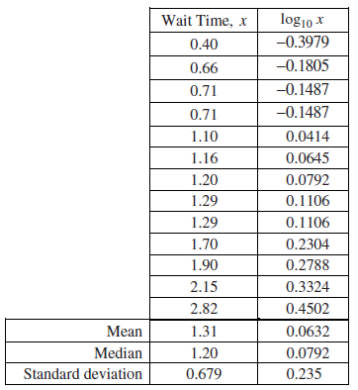 A histogram of the 13 log-transformed data values is shown below.
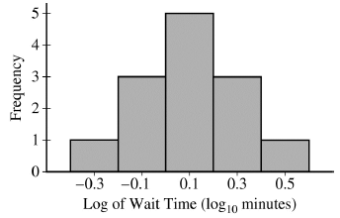 The summary statistics for x and log10x?are repeated below.
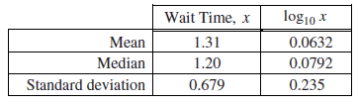 b. Based on the histogram, the conditions for inference have been met for the log-transformed data. Construct and interpret a 95 percent confidence interval for the population mean
μ of the log of the wait times.
c. The mean of the log-transformed data is 0.0632 log10 miniutes, which can be converted back to 1.157 minutes by calculating 100.0632. Convert the endpoints of your interval in part (b) back to minutes and write the resulting interval.
以上就是關(guān)于【2016 AP Statistics統(tǒng)計學(xué)真題Practice Exam系列之簡答題免費(fèi)下載】的解答,如需了解學(xué)校/賽事/課程動態(tài),可至翰林教育官網(wǎng)獲取更多信息。
往期文章閱讀推薦:
新賽季AP如何“彎道超車”?拒絕無效內(nèi)卷!AP科學(xué)選課指南來了!
CB官宣重磅新規(guī)!2027年AP考試開考時間新規(guī)解讀+大考日程發(fā)布!大陸報名搶位開啟行動,翰林3大考點幫你提前鎖位!


翰林AMC8視頻課重磅上線!

國際競賽真題資源免費(fèi)領(lǐng)取






