2016 AP Statistics統(tǒng)計(jì)學(xué)真題系列之簡答題免費(fèi)下載

歷年AP?Statistics統(tǒng)計(jì)學(xué)系列
真題與答案下載

翰林國際教育全網(wǎng)首發(fā)
力爭超快速發(fā)布最全資料
助你在升學(xué)路上一帆風(fēng)順
為你的未來保駕護(hù)航
2016 AP Statistics Free-Response Questions Free Download
2016 AP統(tǒng)計(jì)學(xué)簡答題部分免費(fèi)下載
此套題共計(jì)1小時(shí)30分鐘,共6題
占總分50%
每道大題可能含有不同數(shù)量的小題
其中Part A建議用時(shí)1小時(shí)05分鐘,共5題,占Section II總分75%
Part B建議用時(shí)25分鐘,共1題,占Section II總分25%
可以使用圖形計(jì)算器
考試時(shí)會(huì)提供常用公式表
完整版下載鏈接見文末
部分真題預(yù)覽:
Part A:
1)Robin works as a server in a small restaurant, where she can earn a tip (extra money) from each customer sheserves. The histogram below shows the distribution of her 60 tip amounts for one day of work.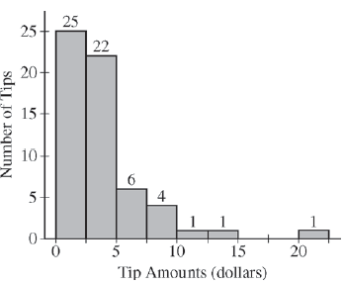
- Write a few sentences to describe the distribution of tip amounts for the day shown.
- One of the tip amounts was $8. If the $8 tip had been $18, what effect would the increase have had on the following statistics? Justify your answers.
The mean:
The median:
Part B:
6)A newspaper in Germany reported that the more semesters needed to complete an academic program at theuniversity, the greater the starting salary in the first year of a job. The report was based on a study that used arandom sample of 24 people who had recently completed an academic program. Information was collected onthe number of semesters each person in the sample needed to complete the program and the starting salary, inthousands of euros, for the first year of a job. The data are shown in the scatterplot below.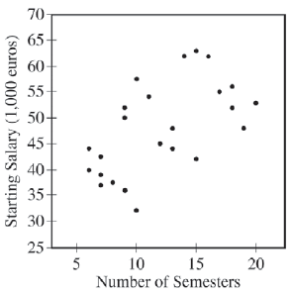
- Does the scatterplot support the newspaper report about number of semesters and starting salary? Justify your answer.
The table below shows computer output from a linear regression analysis on the data.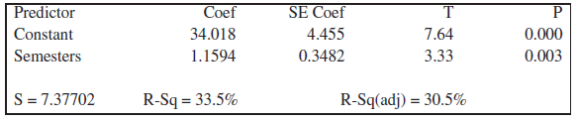
- Identify the slope of the least-squares regression line, and interpret the slope in context.
An independent researcher received the data from the newspaper and conducted a new analysis by separating the data into three groups based on the major of each person. A revised scatterplot identifying the major of each person is shown below.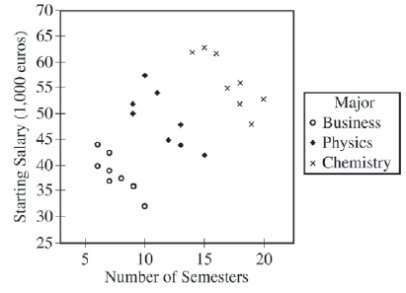
- Based on the people in the sample, describe the association between starting salary and number of semesters for the business majors.
- Based on the people in the sample, compare the median starting salaries for the three majors.
- Based on the analysis conducted by the independent researcher, how could the newspaper report be modified to give a better description of the relationship between the number of semesters and the starting salary for the people in the sample?
完整版真題資料可以底部二維碼免費(fèi)領(lǐng)取↓↓↓
翰林學(xué)員全站資料免費(fèi)打包下載,專享高速下載通道。
[vc_btn title="查看更多AP World History世界史課程相關(guān)詳情" color="primary" align="center" i_icon_fontawesome="fa fa-globe" css_animation="zoomIn" button_block="true" add_icon="true" link="url:http%3A%2F%2Fwww.linstitute.net%2Farchives%2F25886||target:%20_blank|"]
咨詢或AP報(bào)名請?zhí)砑宇檰栁⑿?/strong>

以上就是關(guān)于【2016 AP Statistics統(tǒng)計(jì)學(xué)真題系列之簡答題免費(fèi)下載】的解答,如需了解學(xué)校/賽事/課程動(dòng)態(tài),可至翰林教育官網(wǎng)獲取更多信息。
往期文章閱讀推薦:
新賽季AP如何“彎道超車”?拒絕無效內(nèi)卷!AP科學(xué)選課指南來了!
CB官宣重磅新規(guī)!2027年AP考試開考時(shí)間新規(guī)解讀+大考日程發(fā)布!大陸報(bào)名搶位開啟行動(dòng),翰林3大考點(diǎn)幫你提前鎖位!


翰林AMC8視頻課重磅上線!

國際競賽真題資源免費(fèi)領(lǐng)取






