2017 AP Statistics統計學真題Practice Exam系列之簡答題免費下載

歷年AP Statistics統計學系列
真題與答案下載

翰林國際教育全網首發
力爭超快速發布最全資料
助你在升學路上一帆風順
為你的未來保駕護航
真題下載請前往【純真題】小程序
2017 AP Statistics Practice Exam Free-Response Questions Free Download
2017 AP統計學模考簡答題部分免費下載
此套題僅Section II含有簡答題
共計1小時30分鐘,共6題
占總分50%
每道大題可能含有不同數量的小題
其中Part A建議用時1小時05分鐘,共5題,占Section II總分75%
Part B建議用時25分鐘,共1題,占Section II總分25%
可以使用圖形計算器
考試時會提供常用公式表
完整版下載鏈接見文末
部分真題預覽:
Part A: 1)Population pyramids are a type of bar chart that show the distribution of ages of a country’s population. The distributions of ages of men and women for two countries, A and B, for the year 2015 are shown in the population pyramids below. The age-groups, in years, are listed in the center columns, and the proportions are shown on the horizontal axes. Each bar represents the proportion of the age-group in the population for that sex.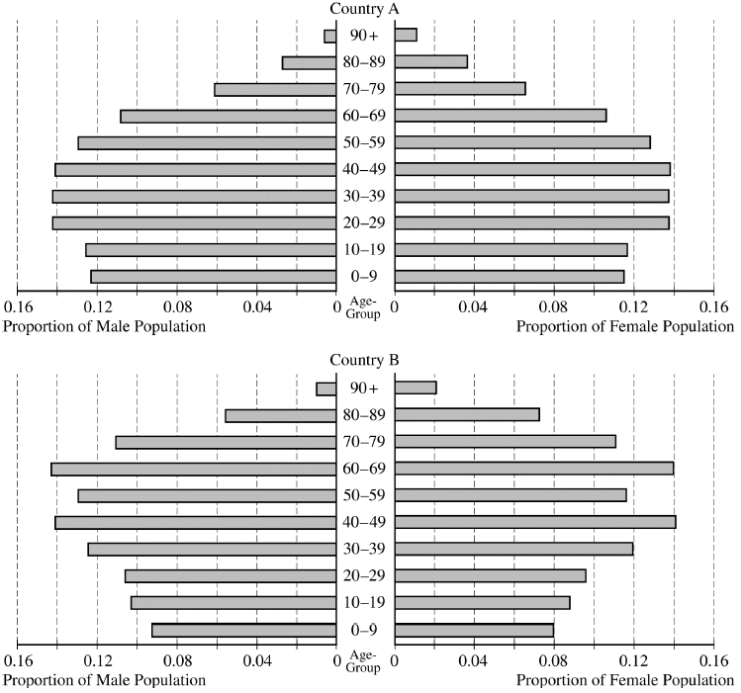
- Is the proportion of the female population age 60 or older in Country A greater than the proportion of the female population age 60 or older in Country B? Justify your answer.
- One of the two countries experienced an increase in the birth rate in the years 1946 to 1955 and another increase in the birth rate about 20 years later. Based on the graphs, which country experienced the described increases in birth rate? Justify your answer using information from the graphs.
- For Country A, in which age-group is the median age of the male population? Justify your answer.
Part B: 6)Emily walks every day, and she keeps a record of the number of miles she walks each day. The histogram and five-number summary below were created from the recorded miles for a random sample of 25 of the days Emily walked.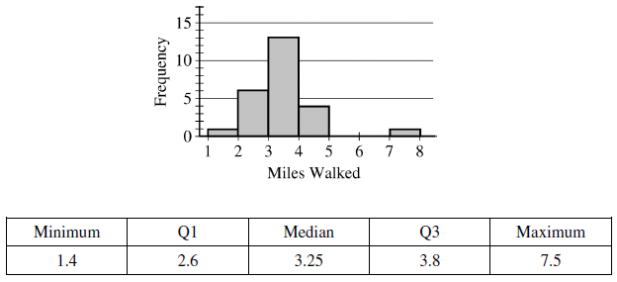 On one of the 25 days in the sample, Emily walked 7.5 miles. From the histogram, it appears that the value 7.5 might be an outlier relative to the other values. Two methods are proposed for identifying an outlier in a set of data.
- One method for identifying an outlier is to use the interquartile range (IQR). An outlier is any number that is greater than the upper quartile by at least 1.5 times the IQR or less than the lower quartile by at least 1.5 times the IQR. Does such a method identify the value of 7.5 miles as an outlier for Emily’s set of data? Justify your answer.
Another method of identifying an outlier is to investigate whether there is evidence that a value might have come from a population with a mean different from the mean of the population of the other values. Let X and Y represent random variables. X is distributed normally with mean mx and standard deviation s, and Y is distributed normally with mean my and standard deviation s. Consider 1 randomly selected value of Y and n - 1 randomly selected values of X.
掃碼添加小助手
獲取更多賽事資訊~

以上就是關于【2017 AP Statistics統計學真題Practice Exam系列之簡答題免費下載】的解答,如需了解學校/賽事/課程動態,可至翰林教育官網獲取更多信息。
往期文章閱讀推薦:
新賽季AP如何“彎道超車”?拒絕無效內卷!AP科學選課指南來了!
CB官宣重磅新規!2027年AP考試開考時間新規解讀+大考日程發布!大陸報名搶位開啟行動,翰林3大考點幫你提前鎖位!


翰林AMC8視頻課重磅上線!

國際競賽真題資源免費領取






