上海世外中學2023年春招開啟,2023年考試安排了解一下!
世外可以說是上海的“明星學校”,是家長和學生心目中一直是數一數二的IB學校。近日,世外發布了2023年國際融合課程高中項目IBDP/A Level招生簡章,目標世外的同學快來了解下吧~ 上海世界外國語中學 學校簡介 上海...

世外可以說是上海的“明星學校”,是家長和學生心目中一直是數一數二的IB學校。近日,世外發布了2023年國際融合課程高中項目IBDP/A Level招生簡章,目標世外的同學快來了解下吧~ 上海世界外國語中學 學校簡介 上海...

普渡大學發布2022年秋季? 國際學生數據報告? 中國本科留學人數在十年內減少2/3 錄取下跌究竟是怎么回事? 曾經的“保底校”不再愛中國學生了? 趕快來一起看看 國際生總數創新高,中國學生人數下滑 今年秋季,普渡...

高分的標化學霸“千篇一律”個性化的活動履歷“萬里挑一” 如何才能從日益激烈的申請中脫穎而出? 熱愛化學的他們都有這些亮點活動! H同學-錄取康奈爾大學 活動履歷(只展示部分): ●英國UKChO化學奧林匹克金獎 ●美...

康奈爾大學由埃茲拉·康奈爾和安德魯·迪克森·懷特于1865年建立,是常春藤八盟校中唯一創建于美國獨立戰爭之后的新生力量,在早申截止時間的前一天,康奈爾大學發布了一個重要通知:ED申請截止時間延長至11月16日。...

近日,七寶德懷特2023學年春季招生平臺開啟!需要報名的同學家長注意及時提交入學申請。該校校將于11月起,在選定日期的周五上午,開展家長訪校活動(學生無需到場)。 七寶德懷特是由上海市七寶中學和美國紐約市...
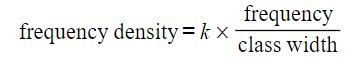
Histograms What is a histogram? A histogram is similar to a bar chart but with some?key differences A histogram is for displaying?grouped continuous data?whereas a bar chart is for?discrete?or?qual...
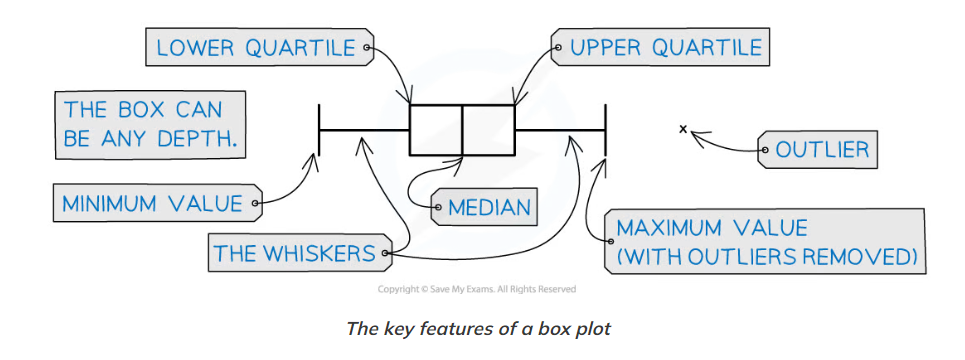
Box Plots What is a box plot? A box plot is a graph that clearly shows key statistics from a data set It shows the?median, quartiles, minimum?and?maximum values?and?outliers It does not show any ot...
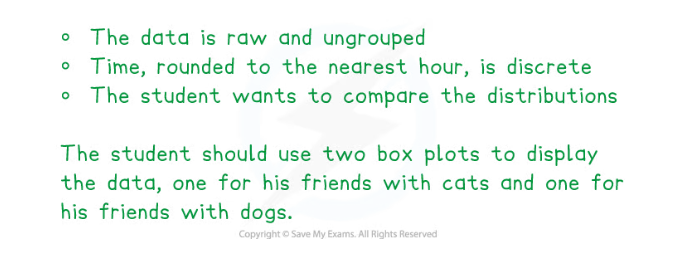
Data Presentation What graphs and diagrams should I be familiar with? You will be expected to be able to use a variety of graphs such as: Box plots Can be used with ungrouped data of a single varia...

10月29日-10月30日,2022丘成桐中學科學獎中國內地賽區——數學獎、物理獎、化學獎、生物獎、經濟金融建模獎半決賽圓滿舉行。分賽區評審委員會對參賽學生進行了面試答辯考評,最終評選出了本年度入圍總決賽的團隊名...
10月29日-10月30日,2022丘成桐中學科學獎中國內地賽區——數學獎、物理獎、化學獎、生物獎、經濟金融建模獎半決賽圓滿舉行。分賽區評審委員會對參賽學生進行了面試答辯考評,最終評選出了本年度入圍總決賽的團隊名...

Coding Sometimes data needs to be coded for further use with calculations. This is particularly useful with data that deals with very small or very large numbers, or with data that needs to be clas...

AMC由美國數學協會于1950年在紐約創辦的數學學術活動。創辦之初參賽學生數便達到了6000人,現在每年更是有30萬來自世界各地的學生慕名參與學術活動。作為美國數學奧林匹克學術活動國家隊選拔的第一關,AMC按照初...


