CIE A Level Maths: Probability & Statistics 1復習筆記1.2.3 Box Plots & Cumulative Frequency

Box Plots
What is a box plot?
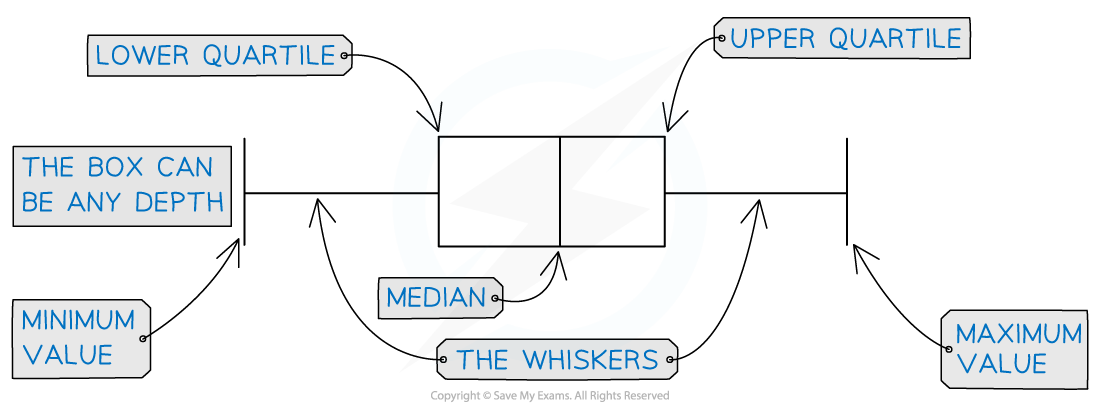
- A box plot is a graph that clearly shows key statistics from a data set
- It shows the?median, quartiles, minimum?and?maximum values?and?outliers
- It does not show any other individual data items
- The middle 50% of the data will be represented by the box section of the graph and the lower and upper 25% of the data will be represented by each of the whiskers
- Only one axis is used when graphing a box plot
- It is still important to make sure the axis has a clear, even scale and is labelled with units
- Box plots are often used for comparing two sets of data
- Both box plots will be drawn one above the other on the same scale on the x-axis
- They are useful for?comparing data?because it is easy to see the main shape of the distribution of the data from a box plot
Worked Example
The incomplete box plot below shows the tail lengths in cm of some students’ pets.
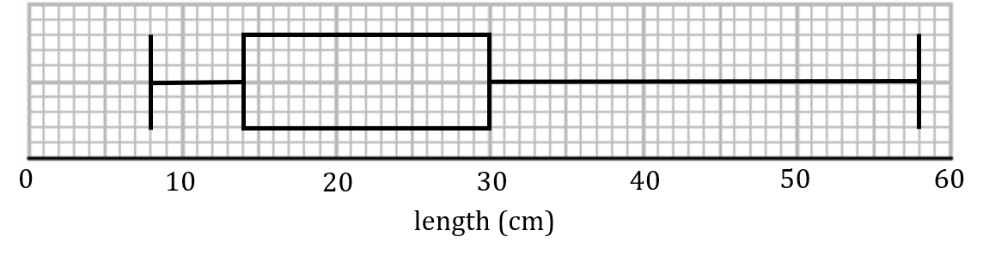
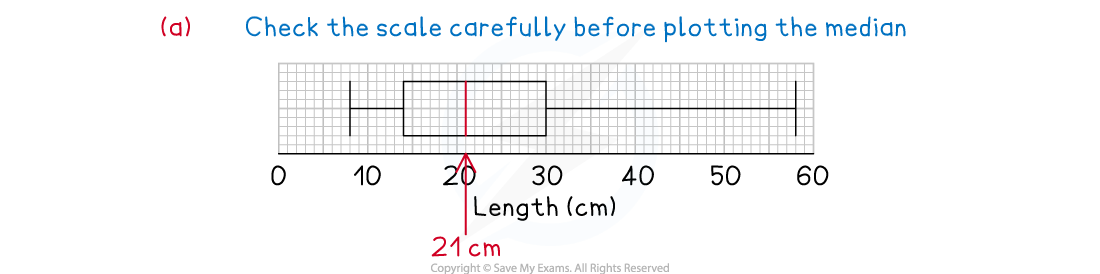
(i)Given that the median tail length was 21 cm, complete the box plot.
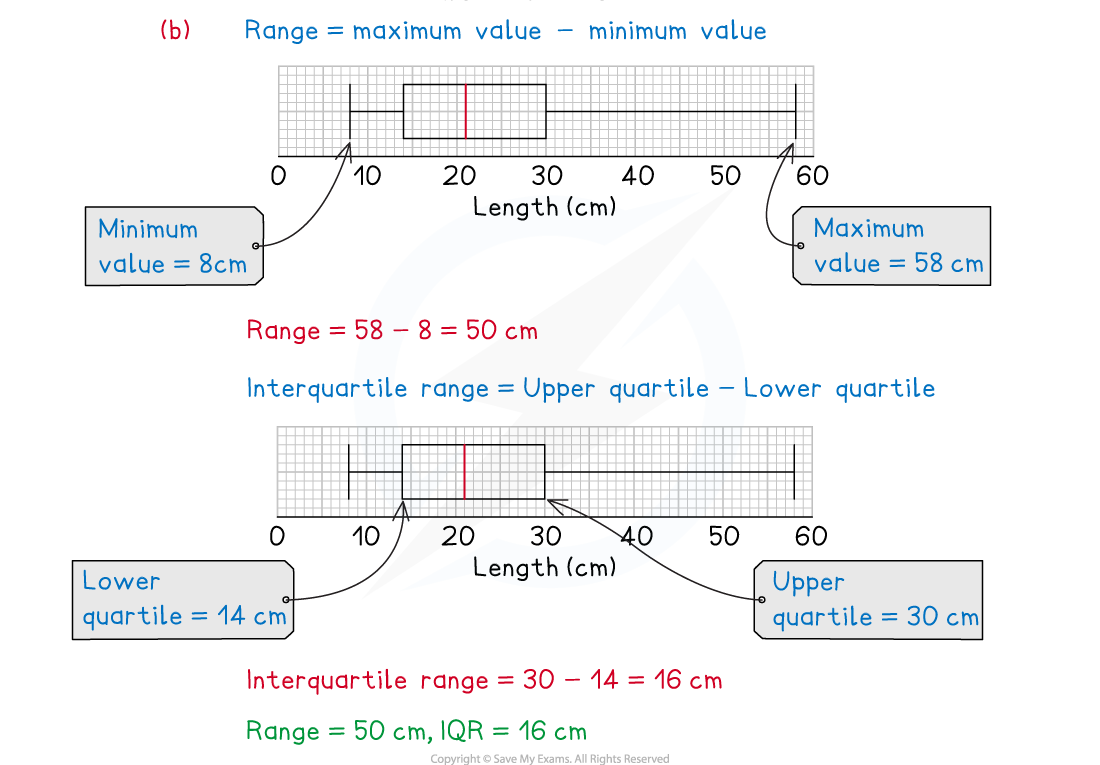
(ii)Find the range and interquartile range of the tail lengths.
Exam Tip
- Remember a box plot is a graph and should be treated like one, even though there is only one axis. It should have a title, a clear, even scale that is labelled with units if there are any. If drawing two box plots on the same axis label each one clearly.
Cumulative Frequency
What is a cumulative frequency graph?
- A cumulative frequency graph is used with data that has been organised into a?grouped frequency?table
- The cumulative frequency graph can be used to find estimates of percentiles and quartiles
- As the data is grouped, it is not possible to find the actual values of these statistics
What are the main features of a cumulative frequency graph?
- A cumulative frequency graph considers how much data there is up to a certain value, including the data in that group and the one below
- Cumulative frequency will always be plotted on the y – axis
- Consider the scale carefully because this will usually be a large number
- You may be asked to add to one or both axes, remember to label both axes clearly and include units on the x – axis if they are needed
- The cumulative frequency is calculated by adding the frequency in each group, or class, to the frequency in the ones before
- This is essentially accumulating the frequencies as you go
- The cumulative frequency for each class must be plotted against the?upper boundary?of each corresponding class
- The cumulative frequency that corresponds with each upper boundary will not only consider the frequency of the data in that class, but all of the data in the groups below it too
- When the points have been plotted they should be joined up with a smooth curve
- However, some may be joined with straight lines from point to point
How do we read statistics from a cumulative frequency graph?
- Quartiles and percentiles can be read from a cumulative frequency graph
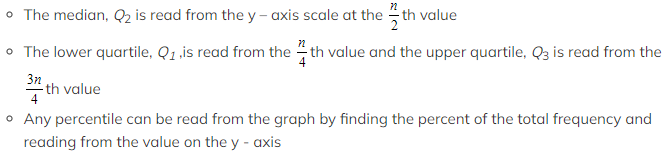 To read the corresponding data value once the position on the y – axis is known, use a ruler to draw a line from the y – axis to the graph and then down to the x – axis
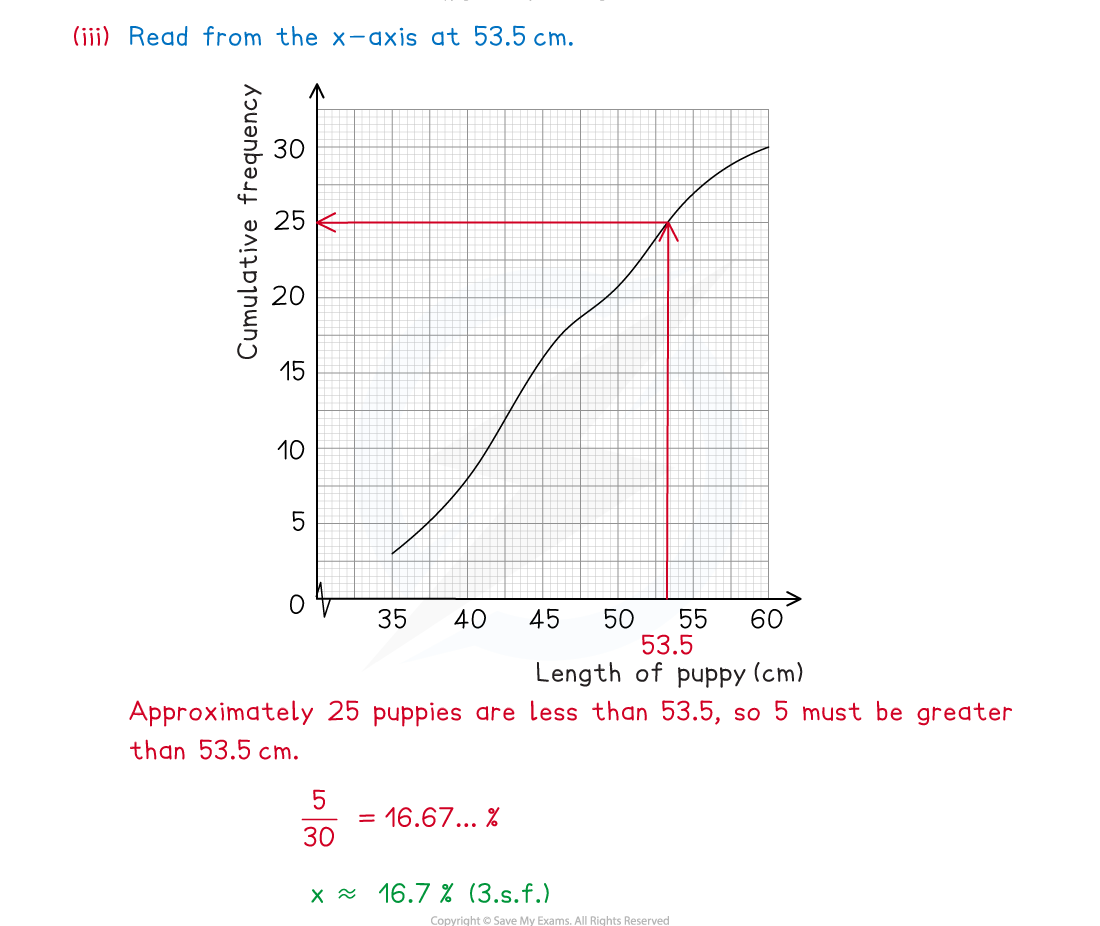
- Sometimes the frequency of values greater than or less than a particular data value will need to be found, this time you will have to read from the x – axis to the y – axis
- Take particular care if the question asks for a frequency greater than a particular data value, the value found from the y – axis will need to be subtracted from the total frequency
Worked Example

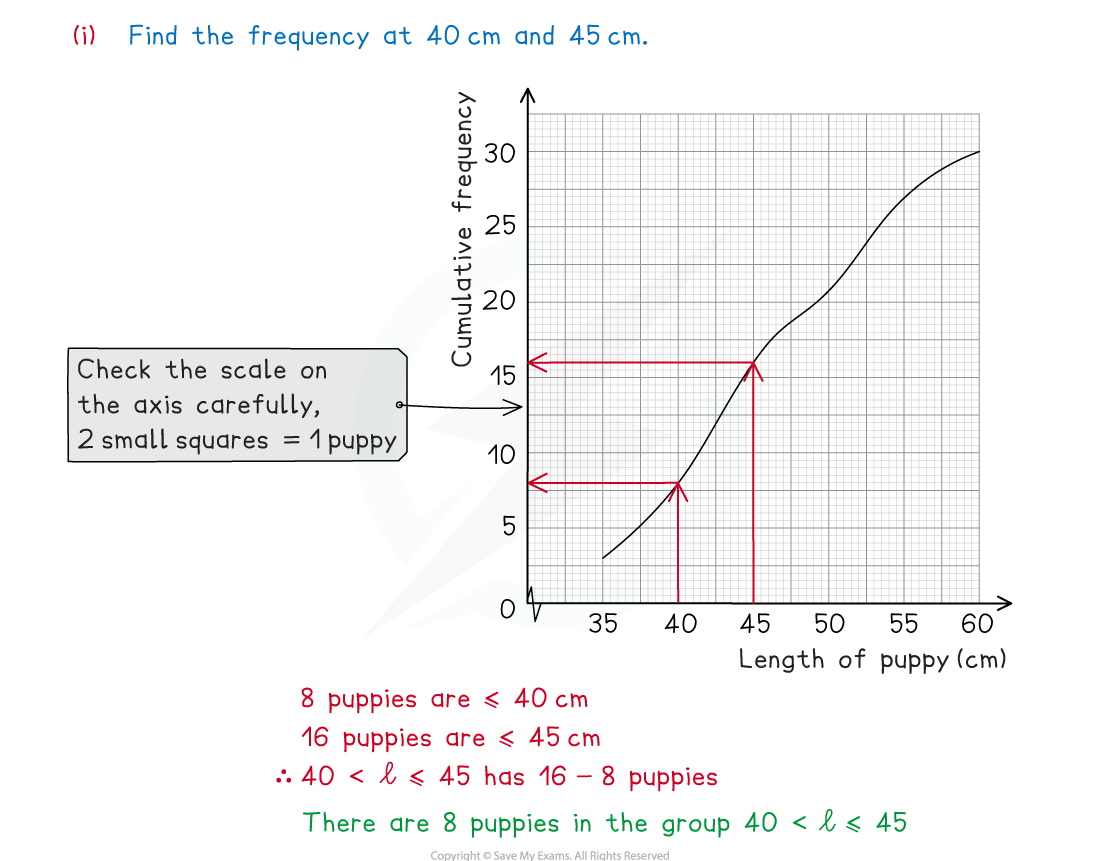
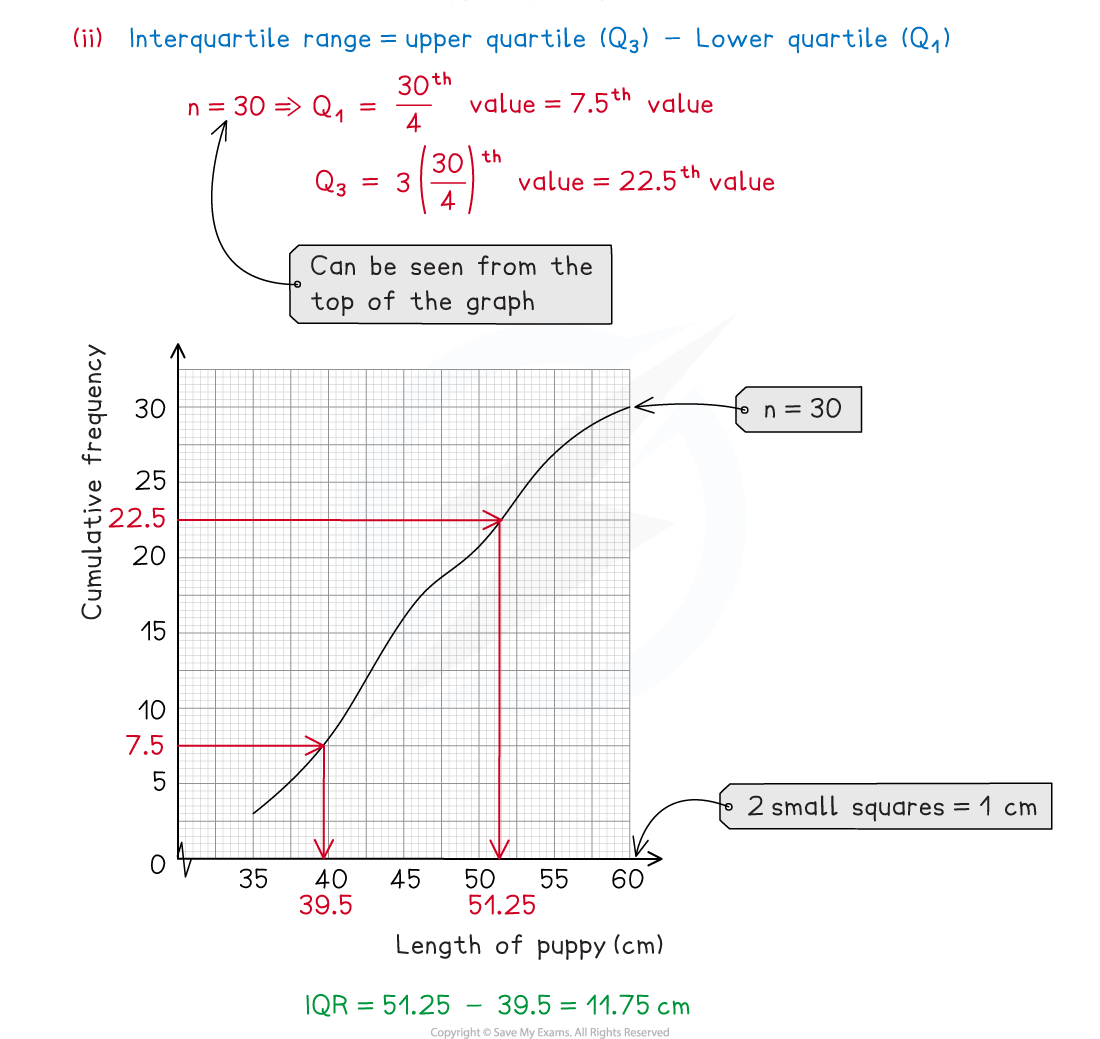
(ii)Use the graph to find an estimate for the interquartile range of the puppies.

Exam Tip
- If you are asked to read values from your graph make sure you use a ruler and mark the lines on clearly to show where you took your readings from. Remember that the graph shows the accumulated frequencies so if you need only the frequency you may need to subtract the previous value.
轉載自savemyexams
以上就是關于【CIE A Level Maths: Probability & Statistics 1復習筆記1.2.3 Box Plots & Cumulative Frequency】的解答,如需了解學校/賽事/課程動態,可至翰林教育官網獲取更多信息。
往期文章閱讀推薦:
2026 ALEVEL 夏考A率出爐!愛德思vs牛津AQA,哪些科目真的“好出分”?
2026 AMC10/12美國數學競賽新賽季!【翰林教育 × 清華大學出版社】獨家教材全面發售!


翰林AMC8視頻課重磅上線!

國際競賽真題資源免費領取






