CIE A Level Maths: Probability & Statistics 1復習筆記1.2.2 Stem and Leaf Diagrams

Stem and Leaf Diagrams
What is a stem and leaf diagram?
- A?stem?and?leaf?diagram shows?ALL?RAW?data and groups it into?class?intervals
- Stem and leaf diagrams lend themselves to two-digit data but can be used with three-digit data, rarely more
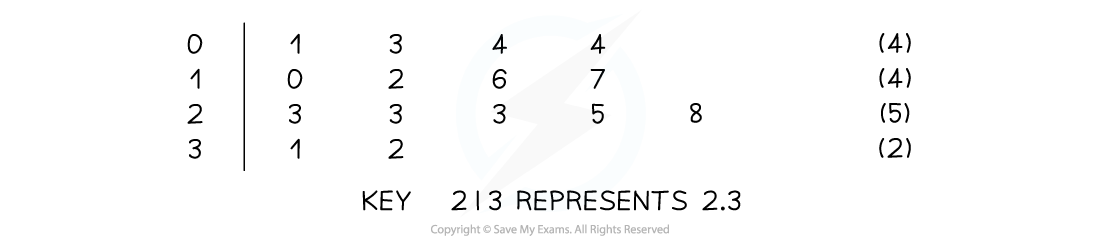
- The numbers in?brackets?indicate how many values are in that class interval
- These are not always included but can be useful when there is a large amount of data to display
How do I draw a stem and leaf diagram?
- Identify the?stems?and the?leaves
- Leaves?would always be?single?digits
- the number?2?would be represented by?12 | 2
- Leaves?would always be?single?digits
- If starting from?unordered?data draw?two?diagrams
- The?first?diagram should get the data into the right?format
-
- i.e.? ? ?a list of stems with their corresponding leaves
-
- The?second?diagram should have stems and leaves in?order, with a?key
- This helps?accuracy?as values are less likely to be missed out
- The?first?diagram should get the data into the right?format
What are stem and leaf diagrams used for?
- The data is arranged into?classes?so at a glance it is possible to see the?modal?class?interval
- As the data is in order the?median,?quartiles,?maximum?and?minimum?can be identified easily
- Check you can do this – find the minimum, maximum, median and upper and lower quartiles from the stem and leaf diagram at the start of this revision note
- Note that these five values are those needed in order to construct a?box?and-whisker?diagram?(box plot)
- Outliers, once defined, can be easily identified and removed
What about back-to-back stem and leaf diagrams?
- These are used when it is helpful for the data to be split into two comparable categories such as boy/girl, child/adult, UK/non-UK. Etc
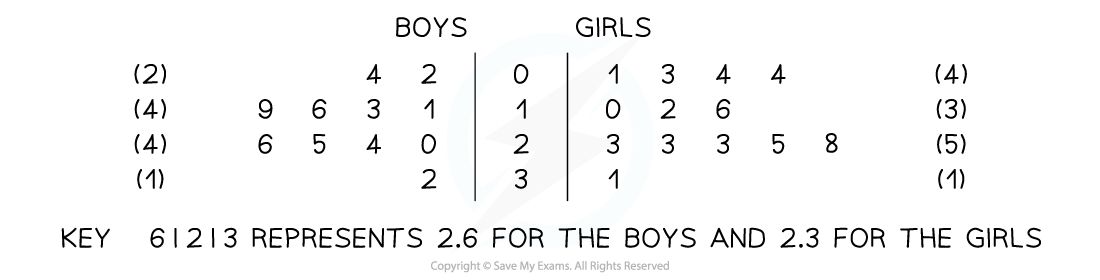
- Note that the leaves on the left-hand side of the stems (Boys) increase from the centre outwards
Are there any variations on stem and leaf diagrams?
- There are a few minor variations on stem and leaf diagrams that you may see online or in different textbooks
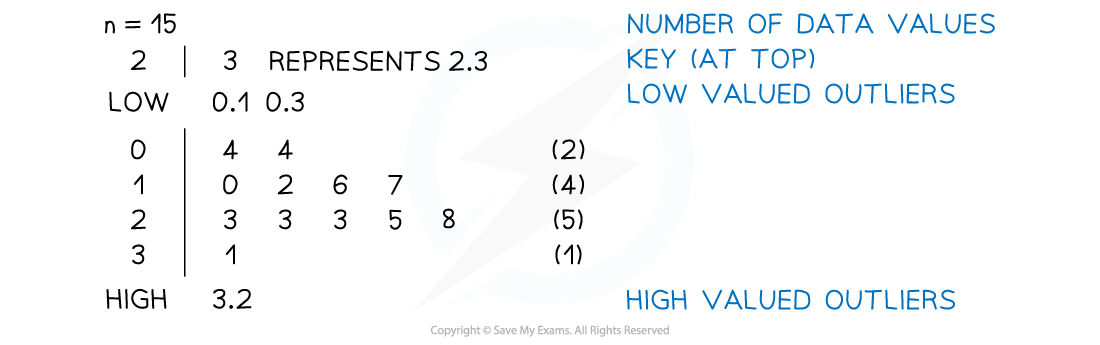
- Some or all the different/extra features in the diagram above may appear
- These differences can be applied to back-to-back stem and leaf diagrams
- With large amounts of data, the stems may be split into?two?rows
- Every stem will be listed?twice
- The?first?row for a?stem?will contain?leaves?0 - 4
- The?second?row will contain?leaves 5 - 9
What might I be asked to do with a stem and leaf diagram?
- You may be asked to?draw?or?complete?a stem and leaf diagram
- Find?statistical?measures?–?median,?quartiles?and interquartile range in particular
- From which you may be required to draw a?box-and-whisker?diagram
- Identify and remove?outliers
- Compare?data shown by stem and leaf diagrams (either separate or back-to-back); comment on two things and each should be in both terms of the maths and the context of the question
- a comment about?average?(use median)
e.g. the girls’?median?of 88% was higher than the boys’ median of 65% so on average the girls performed better on the test
-
- a comment about?variation?(spread) (use interquartile range)
e.g. the girls’?interquartile?range?of 30% was greater than the boys’ 15% so the boys had more consistent scores on the test
- Analyse?what would happen to statistical measures such as the median and quartiles if a?value?changed?or a?new?value?were to be added to the data
Worked Example
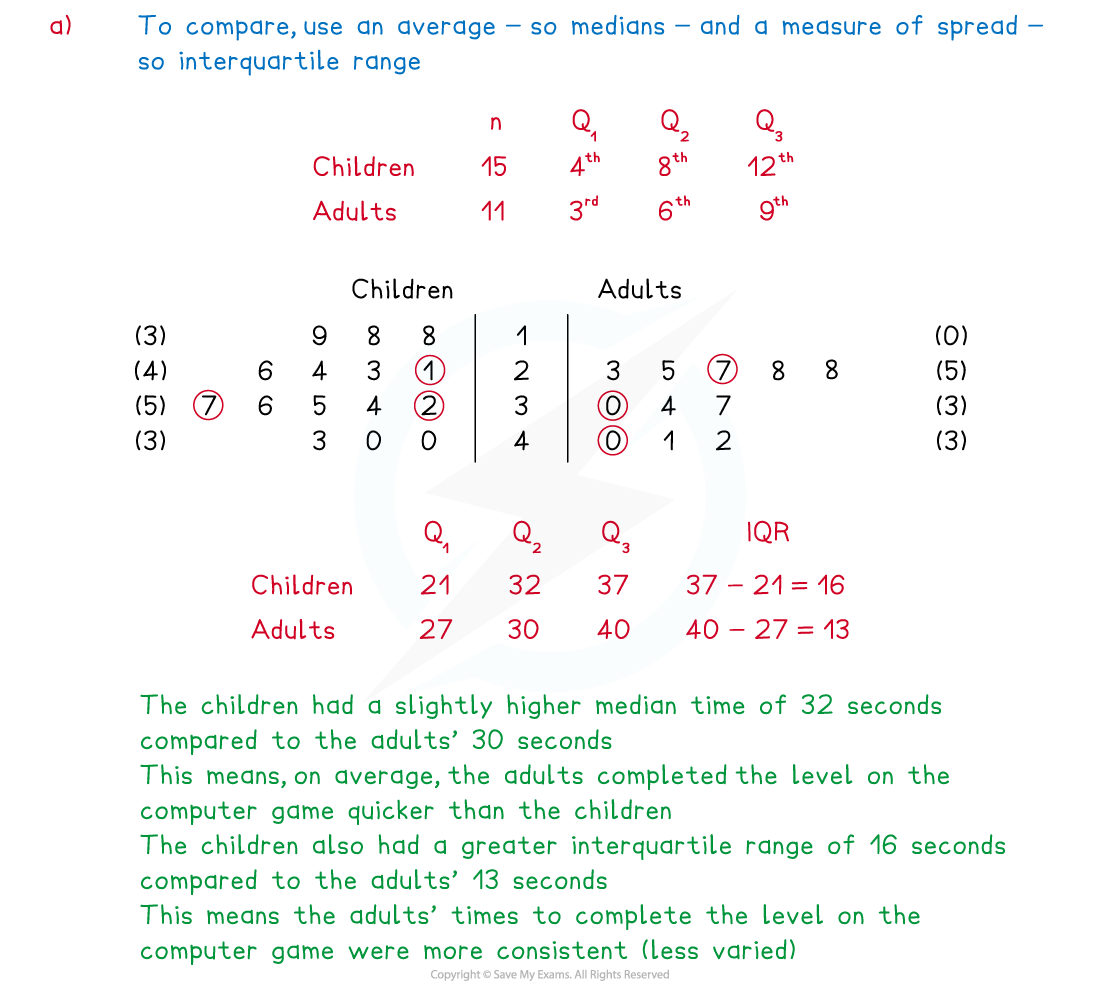
The following stem and leaf diagrams show the times taken by some children and adults to complete a level on a computer game.
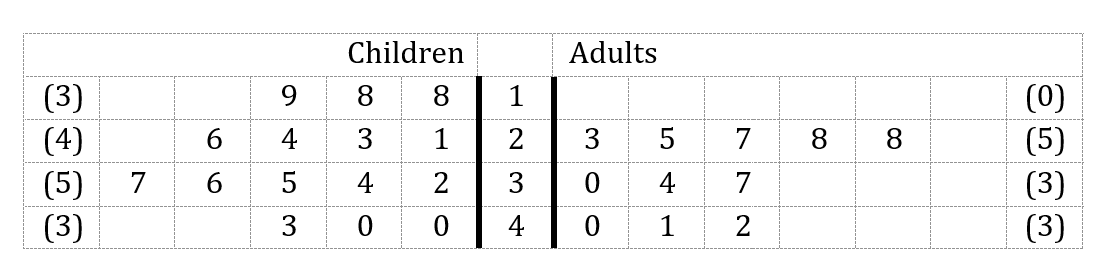
2 | 3 represents a time of 23 seconds
(a)Compare the times taken to complete the level between the children and the adults.
(b)It is later discovered two of the adults’ times had been omitted from the diagram –times of 23 and 42 seconds.
Briefly explain whether adding these times would change the adults’ median time.
Briefly explain whether adding these times would change the adults’ median time.
(a)Compare the times taken to complete the level between the children and the adults.
(b)It is later discovered two of the adults’ times had been omitted from the diagram –times of 23 and 42 seconds.
Briefly explain whether adding these times would change the adults’ median time.
Briefly explain whether adding these times would change the adults’ median time.

Exam Tip
- Accuracy?is important
- (Lightly) tick off values as you add them to a stem and leaf diagram
- Check you have the right number of data values in total on your diagram
- Other checks can include ensuring the median has the same number of values either side of it
轉載自savemyexams
以上就是關于【CIE A Level Maths: Probability & Statistics 1復習筆記1.2.2 Stem and Leaf Diagrams】的解答,如需了解學校/賽事/課程動態,可至翰林教育官網獲取更多信息。
往期文章閱讀推薦:
2026 ALEVEL 夏考A率出爐!愛德思vs牛津AQA,哪些科目真的“好出分”?
2026 AMC10/12美國數學競賽新賽季!【翰林教育 × 清華大學出版社】獨家教材全面發售!


翰林AMC8視頻課重磅上線!

國際競賽真題資源免費領取






