A-Level化學課程難不難?附真題練習
A-Level化學課程難不難? 化學是A-Level科目中最難的科目之一,涉及很多復雜的概念以及需要記憶的知識點。 然而化學是很多學科與專業的基礎,許多理工科的大學專業,比如生物、化學、醫藥、食品等都會要求申請者...

A-Level化學課程難不難? 化學是A-Level科目中最難的科目之一,涉及很多復雜的概念以及需要記憶的知識點。 然而化學是很多學科與專業的基礎,許多理工科的大學專業,比如生物、化學、醫藥、食品等都會要求申請者...

Scatter Diagrams What does bivariate data mean? A lot of statistics is about looking at how different factors, or?variables?change how data behaves Bivariate data?is data which is collected on two ...

A-level數學向來以難度大、要求高而著稱,它是很多大學在錄取時十分看重的科目,尤其是申請STEM專業,數學基本是必修課。學好A-level數學作用很大 !A-Level數學考試內容有哪些?附真題及答案~ 關于A Level數學 ...
Interpreting Data You may be asked to comment on how statistics could affect data or how removing or adding a new piece of data could change statistics you have calculated. You may also be asked to...

Outliers What are outliers? Outliers are extreme data values that do not fit with the general pattern of the data They can come from one or two extreme events or from mistakes in the data collectio...
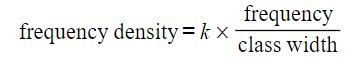
Histograms What is a histogram? A histogram is similar to a bar chart but with some?key differences A histogram is for displaying?grouped continuous data?whereas a bar chart is for?discrete?or?qual...
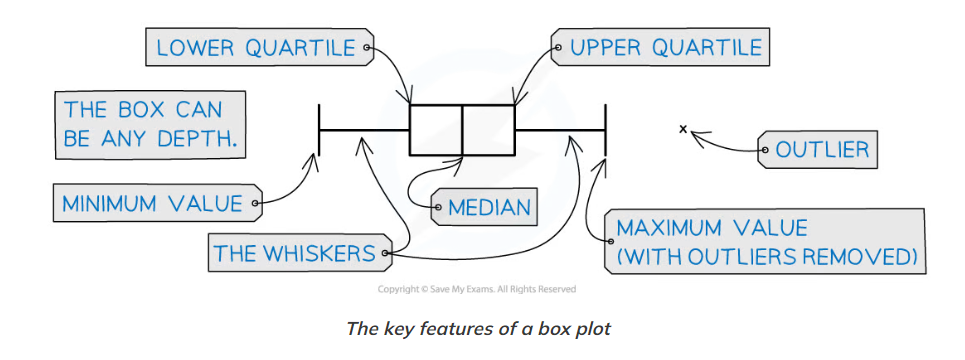
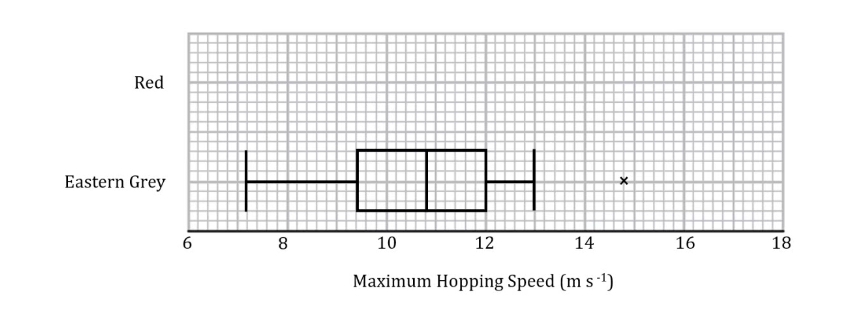
Box Plots What is a box plot? A box plot is a graph that clearly shows key statistics from a data set It shows the?median, quartiles, minimum?and?maximum values?and?outliers It does not show any ot...
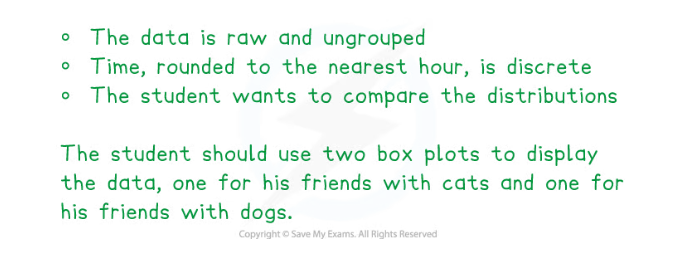
Data Presentation What graphs and diagrams should I be familiar with? You will be expected to be able to use a variety of graphs such as: Box plots Can be used with ungrouped data of a single varia...

Coding Sometimes data needs to be coded for further use with calculations. This is particularly useful with data that deals with very small or very large numbers, or with data that needs to be clas...


