Edexcel A Level Economics A:復(fù)習(xí)筆記3.4.3 Monopolistic Competition

Characteristics of Monopolistic Markets
- The characteristics of?monopolistic competition?are as follows
- There are a large number of small firms:?each one is relatively small and can act independently of the market
- There is low?barriers to entry?& exit from the industry:?firms can start-up or leave the industry with relative ease which increases the level of competition
- The products are slightly?differentiated: this structure exists as consumers have different desires e.g. two nail bars differentiate their product through express or pampered service. Some consumers want an express service & others want to linger. A relatively homogenous product has now been differentiated
- There is a?low degree of market power?& some price setting ability
Profit Maximising Equilibrium in the Short & Long-run
- In order to?maximise profit, firms in monopolistic competition produce up to the level of output where?marginal cost?=?marginal revenue?(MC=MR)
- The firm does have some?market power?and is able to influence the price & quantity
- The firm is a?price maker
- This is due to the fact that they have a?differentiated product?that is desirable by certain consumers
- The firm is a?price maker
- The firm can make?supernormal profit?in the short-run
- In the long-run, the firm will return to a long-run equilibrium position in which they make?normal profit
- This is due to inability to defend against?new competitors who enter the market?& copy the products of existing sellers
- Firms will attempt to find new ways to?differentiate their product?to prolong the period of supernormal profit e.g. a barber shop may add in a pool table & beer fridge for their customers to enjoy thus making them different from the competition (for a period of time)
Monopolistic Competition Diagrams
Short-run Profit Maximisation
- Firms in?monopolistic competition?are able to make?supernormal profit?in the?short-run
- The?AR curve?is the?demand curve?of the firm & it is downward sloping
- ?The firm has some?market power?due to the level of?product differentiation?that exists
- To sell an additional unit of output, the firm will have to decrease its price
- The?marginal revenue (MR)?curve will fall twice as quickly as the AR
- ?The firm has some?market power?due to the level of?product differentiation?that exists
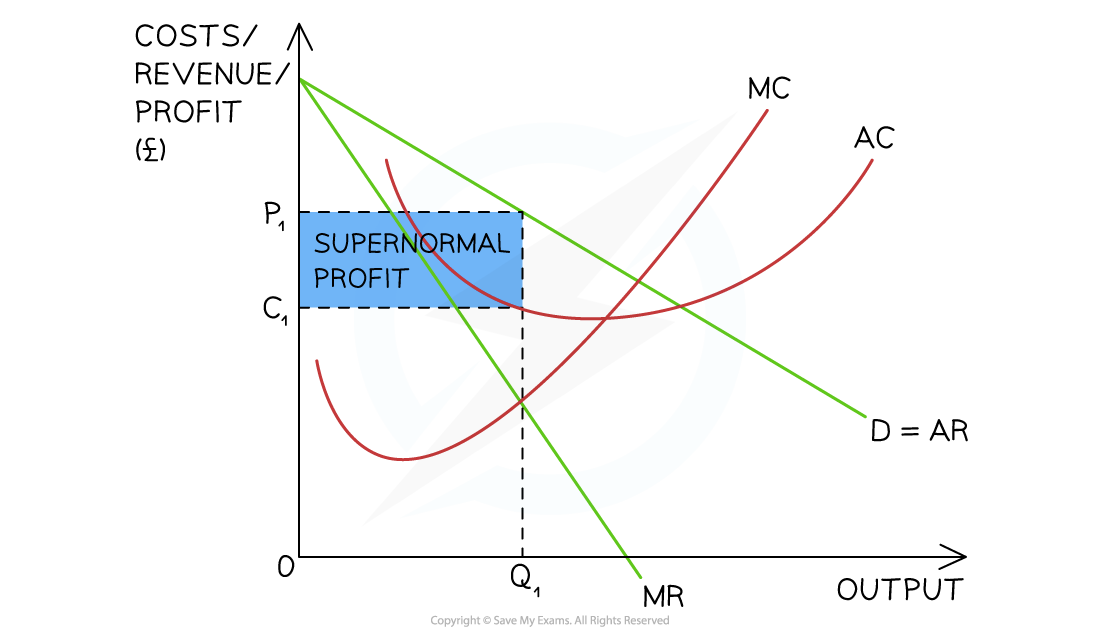
A diagram illustrating a monopolistically competitive firm making supernormal profit in the short-run as the AR > AC at the profit maximisation level of output (Q1)
Diagram Analysis
- The firm produces at the?profit maximisation level of output?where?MC = MR (Q1)
- At this level the AR (P1) > AC (C1)
- The firm is making supernormal profit
Short-run Losses
- Firms in?monopolistic competition?are able to make?losses?in the?short-run
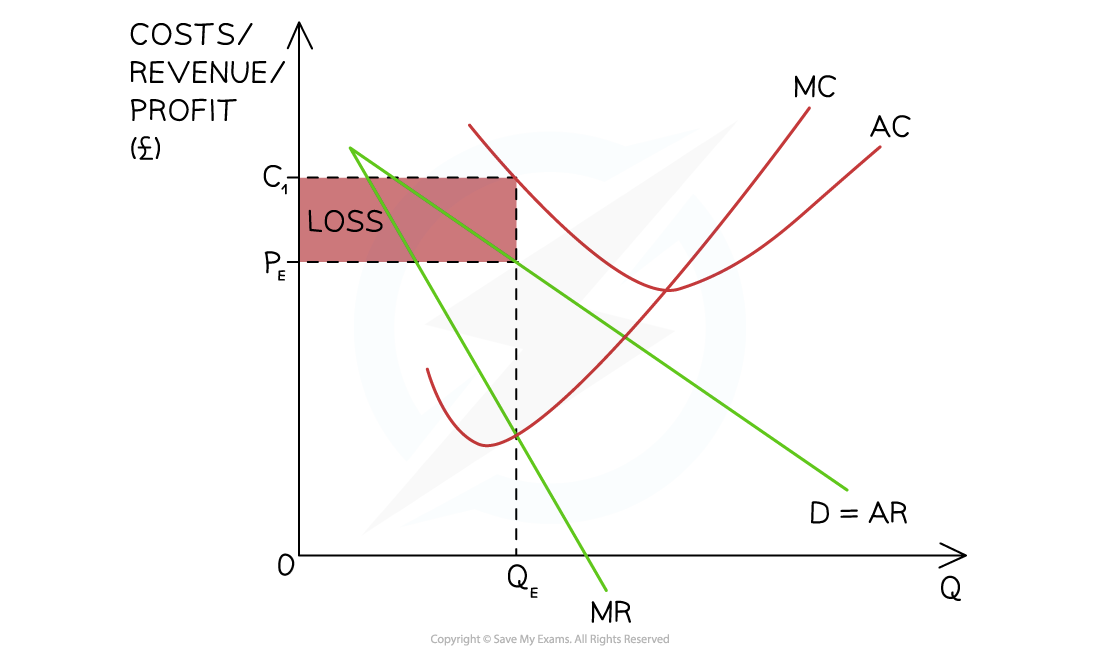
A diagram illustrating a monopolistically competitive firm making losses in the short-run as the AR (PE?) <? AC at the profit maximisation level of output (QE)
Diagram Analysis
- The firm produces at the?profit maximisation level of output?where?MC = MR (QE)
- At this level of output, the?AR (PE) < AC (C1)
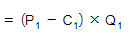
- The firm's loss is

Moving From Short-run Profit/Loss to the Long-run Equilibrium
From Supernormal to Normal Profit
- If firms in?monopolistic competition?make?supernormal profit?in the?short-run,?new entrants are attracted to the industry & the number of sellers increases
- They are?incentivised?by the opportunity to make supernormal profit
- There are low?barriers to entry
- It is easy to join the industry
- Supernormal profit will be eroded & the firm will return to the long-run equilibrium position of making normal profit
From Losses to Normal Profit
- If firms in?monopolistic competition?make losses?in the?short-run,?some will shut down
- The?shut down rule?will determine which firms shut down
- There are low?barriers to exit, so it is easy to leave the industry
- For the remaining firms, losses will be?eliminated?& the firm will return to the?long-run equilibrium?position of making?normal profit
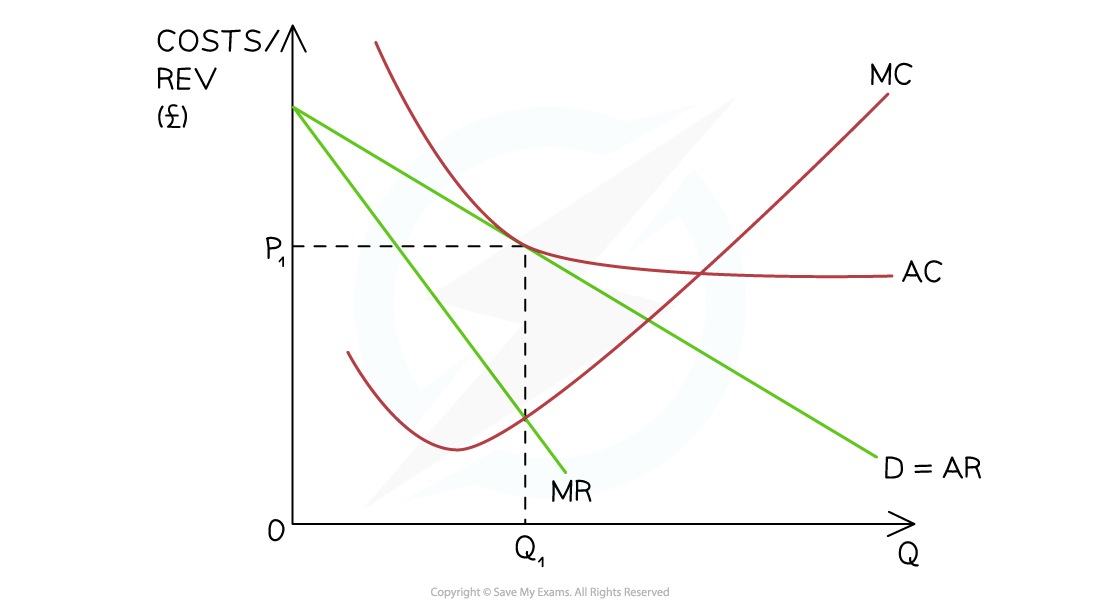
A diagram illustrating the long-run equilibrium position for a monopolistically competitive firm?which is making normal profit. AR (P1) = AC at the profit maximisation level of output (Q1)
Diagram Analysis
- The firm is initially producing at the?profit maximisation level of output?where?MC=MR (Q1)
- At this level of output P1 = AC & the firm is making normal profit
- In the long-run,?firms in?monopolistic competition?always make?normal profit
- Firms making a?loss?leave the industry
- Firms making?supernormal profit?see it slowly?eradicated?as new firms join the industry
轉(zhuǎn)載自savemyexams
以上就是關(guān)于【Edexcel A Level Economics A:復(fù)習(xí)筆記3.4.3 Monopolistic Competition】的解答,如需了解學(xué)校/賽事/課程動態(tài),可至翰林教育官網(wǎng)獲取更多信息。
往期文章閱讀推薦:
斯坦福大學(xué)官方推薦書單!名校學(xué)霸們暑假都在讀什么?
MIT官方發(fā)布【2026年夏季推薦閱讀書單】!橫跨科學(xué)/人文/經(jīng)濟...


翰林AMC8視頻課重磅上線!

國際競賽真題資源免費領(lǐng)取






