Edexcel A Level Economics A:復習筆記2.5.2 Output Gaps

Actual Growth & Long-term Growth
- Actual growth?can be differentiated from the idea of?long-term trends?in growth rates
- A long-term growth trend is the underlying?trend rate of economic growth?over a longer period of time
- This is determined by the?constant increases?in the?productive capacity of an economy (aggregate supply)
- The increase in?productive capacity?is illustrated by a rightward shift of the long-run aggregate supply curve (LRAS)
- Use of long-term growth trends can reduce the?impact of outliers?in the data
- This is determined by the?constant increases?in the?productive capacity of an economy (aggregate supply)
Positive & Negative Output Gaps
- An?output gap?is the difference between the?actual level?of output?(real GDP)?and the?maximum potential?level of output
- A?positive output gap?occurs when real GDP is greater than the potential real GDP
- A?negative output gap?occurs when the real GDP is less than the potential real GDP
- There is?spare capacity?in the economy to produce more goods/services than are being produced
- It is?difficult to measure output gaps?accurately
- This is because it is hard to know exactly what the?maximum productive potential?of an economy is
- Rapidly rising prices?can indicate a?positive gap?is developing
- Rising unemployment?and?slowdown?in economic growth can indicate that a?negative gap is increasing
A Negative Output Gap
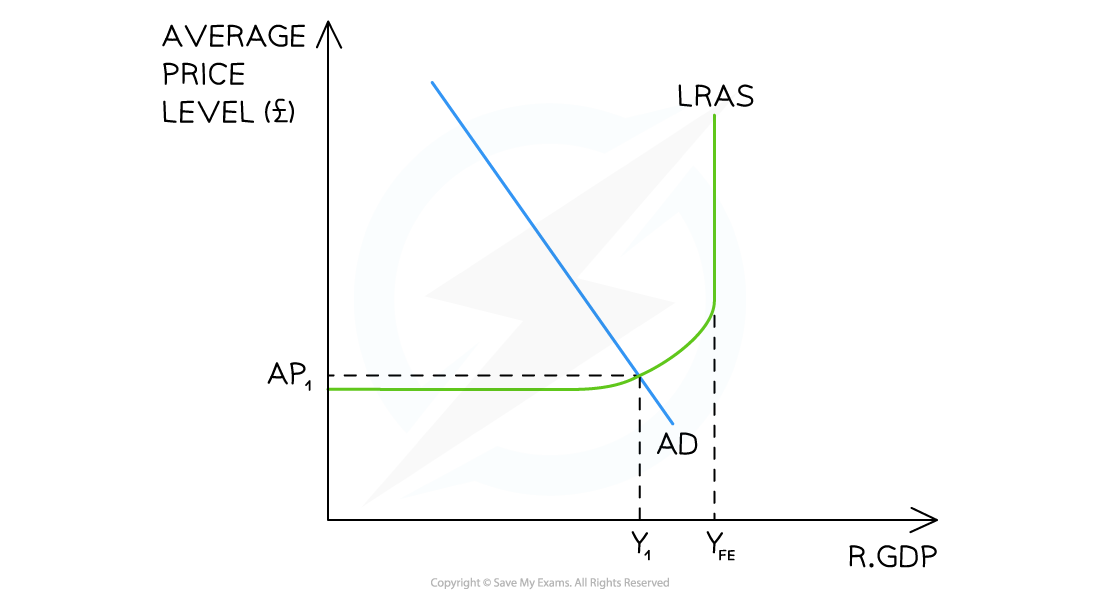
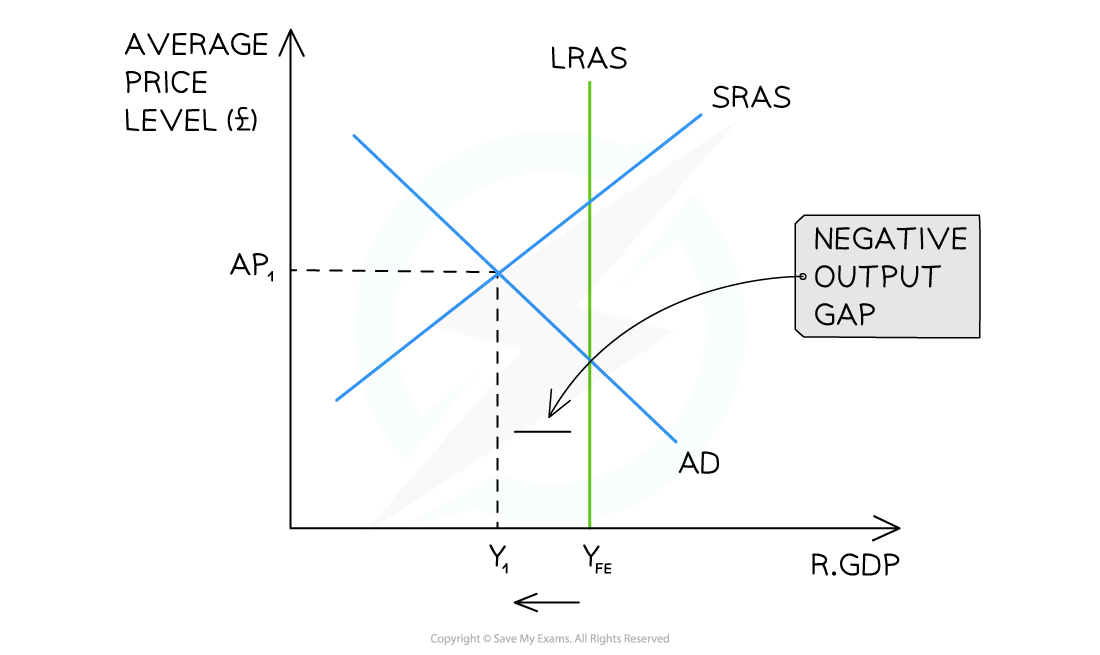
An Keynesian (top) and Classical (bottom) diagram illustrating an economy that has a negative output gap (Y1- YFE) and is currently producing less than its potential output
Diagram Analysis
- The potential output of this economy is at?YFE
- The economy is in a?short-run equilibrium?at AP1Y1
- A negative output gap exists at?Y1?- YFE
- This effectively gives the economy?sparer capacity?in the short-term
- One cause of this may be that the?AD has recently decreased?due to a fall in consumption
- The?Classical view?is that the output will return to?YFE??in the long-run, but at a?lower average price level
- The?Keynesian view?is that an economy may be stuck in a?negative output gap?for a long period of time
- A negative output gap exists at?Y1?- YFE
A Positive Output Gap
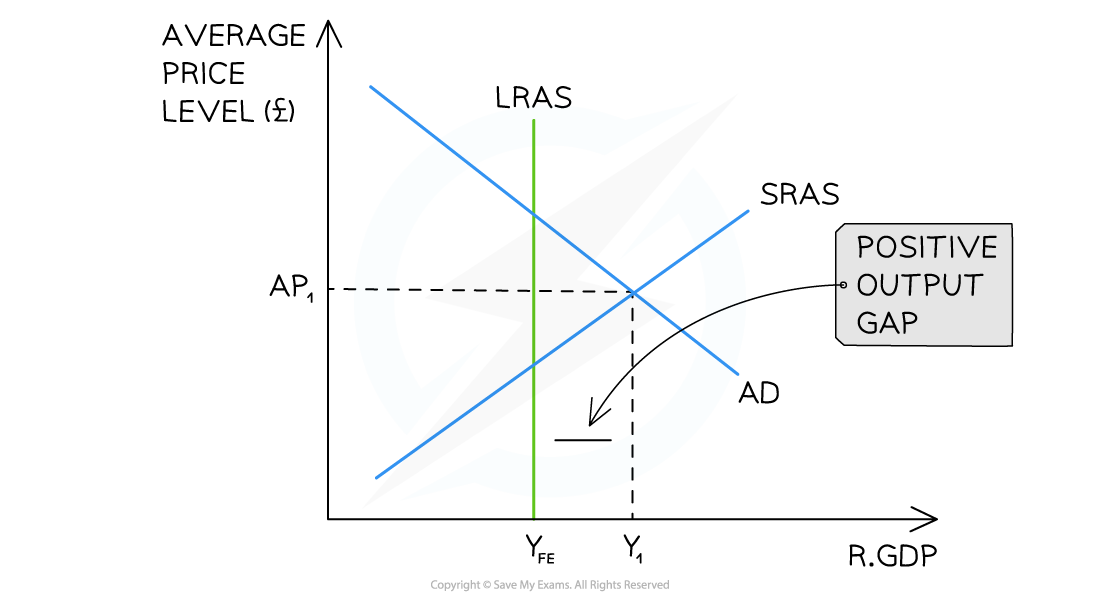
An AD/AS diagram illustrating an economy that has a positive output gap (YFE?- Y1) and is currently producing more than its potential output
Diagram Analysis
- The?potential output?of this economy is at?YFE
- The economy is in a?short-run equilibrium?at AP1Y1
- A positive output gap exists at?YFE?- Y1
- This effectively gives the economy?more productive?capacity?in the short-term
- One cause of this may be that workers are willing to?work overtime?once full capacity is reached
- It is?not sustainable?and the?Classical view?is that the output will return to?YFE,?but at a?higher price level
- A positive output gap exists at?YFE?- Y1
轉載自savemyexams
以上就是關于【Edexcel A Level Economics A:復習筆記2.5.2 Output Gaps】的解答,如需了解學校/賽事/課程動態,可至翰林教育官網獲取更多信息。
往期文章閱讀推薦:
2026 ALEVEL 夏考A率出爐!愛德思vs牛津AQA,哪些科目真的“好出分”?
2026 AMC10/12美國數學競賽新賽季!【翰林教育 × 清華大學出版社】獨家教材全面發售!


翰林AMC8視頻課重磅上線!

國際競賽真題資源免費領取






