Edexcel A Level Economics A:復習筆記1.4.1 Government Intervention in Markets

Government Intervention in Markets
- Nearly every economy in the world is a?mixed economy?and has varying degrees of?government intervention
- Governments intervention is necessary for several reasons
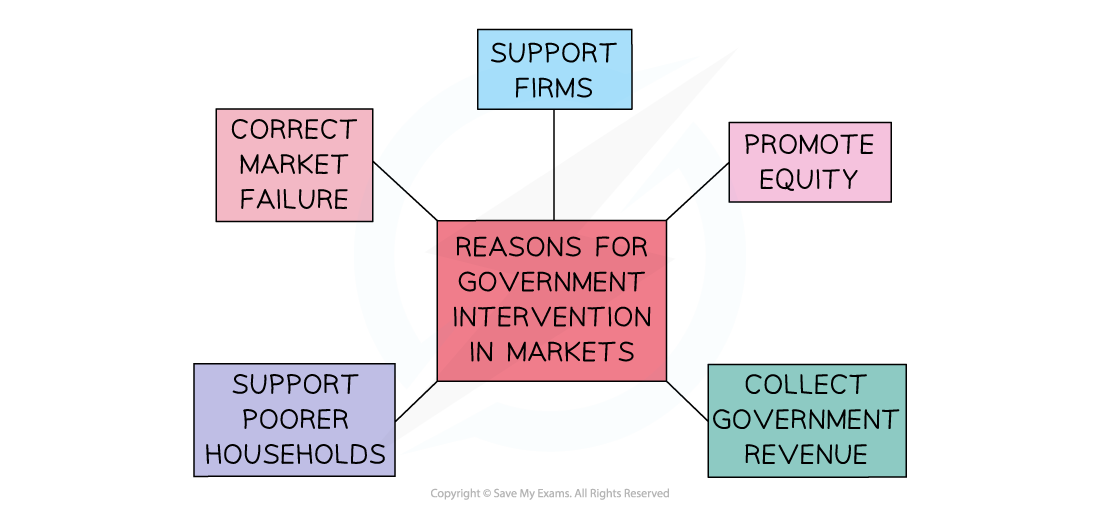
A diagram showing several reasons for government intervention in mixed economic systems
- Correct market failure:?in many markets there is a?less than optimal allocation?of resources from society's point of view
- In maximising their self-interest, firms and individuals?will not self-correct?this allocation of resources and there is a role for the government
- They often achieve this by?influencing?the level of?production or consumption
- Earn government revenue: governments need money to provide?essential services, public and merit goods
- Revenue is raised through intervention such as taxation,?privatisation, sale of licenses (e.g.?5G licenses), and sale of goods/services
- Promote equity:?to reduce the opportunity gap between the rich and poor
- Support firms:?in a global economy, governments choose to?support key industries?so as to help them remain competitive
- Support poorer households:?poverty has multiple impacts on both the individual and the economy
- Intervention seeks to?redistribute income?(tax the rich and give to the poor) so as to reduce the impact of poverty
- Four of the most common methods used to intervene in markets are?indirect taxation, use of?subsidies,?maximum prices, and?minimum prices
Indirect Taxation
- An?indirect tax?can be either?ad valorem?or?specific
Ad Valorem Tax
- Value added tax (VAT) is 20% in the UK in 2022. The?more?goods/services consumed, the?larger the tax bill
- This causes the second supply curve to?diverge?from the?original?supply curve
- VAT raises significant?government revenue
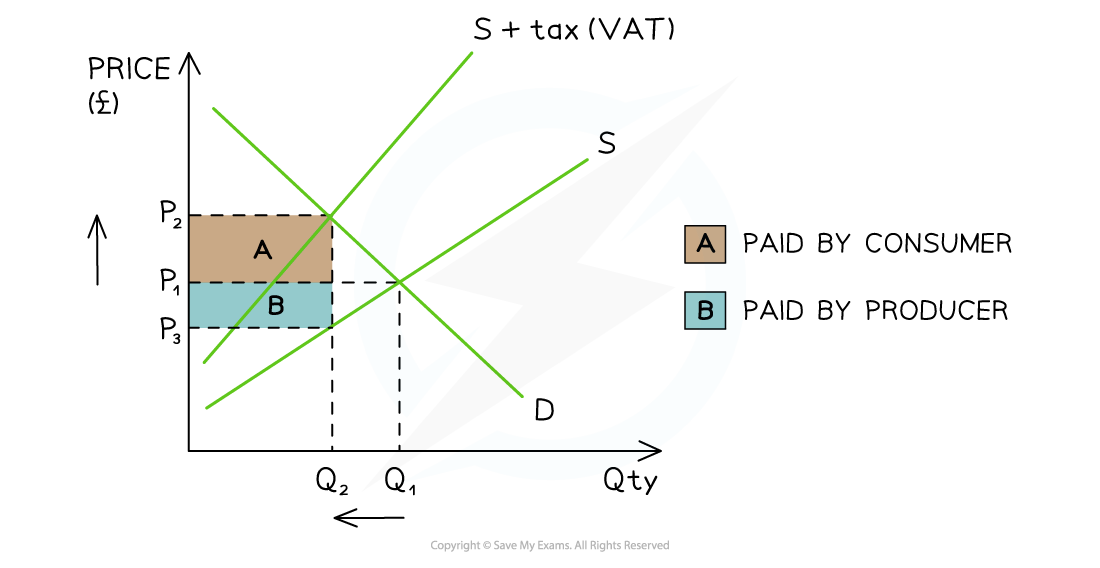
A diagram showing an ad valorem tax (VAT) and the tax incidence for producers and consumers
Diagram Analysis
- Initial?equilibrium?is at P1Q1
- Supply?shifts?left due to the tax from S → S + tax
- The two supply curves?diverge?as percentage tax means?more tax?is paid at?higher prices
- Consumer incidence?of tax is (P2?- P1) x Q2?- Area A
- Producer incidence?of tax is (P1?- P3) x Q2?- Area B
- New equilibrium is at P2Q2
- Final price is?higher?(P2) and QD is?lower?(Q2)
Specific Tax on Negative Externality of Production
- Governments frequently tax firms that pollute or create harmful external costs in production
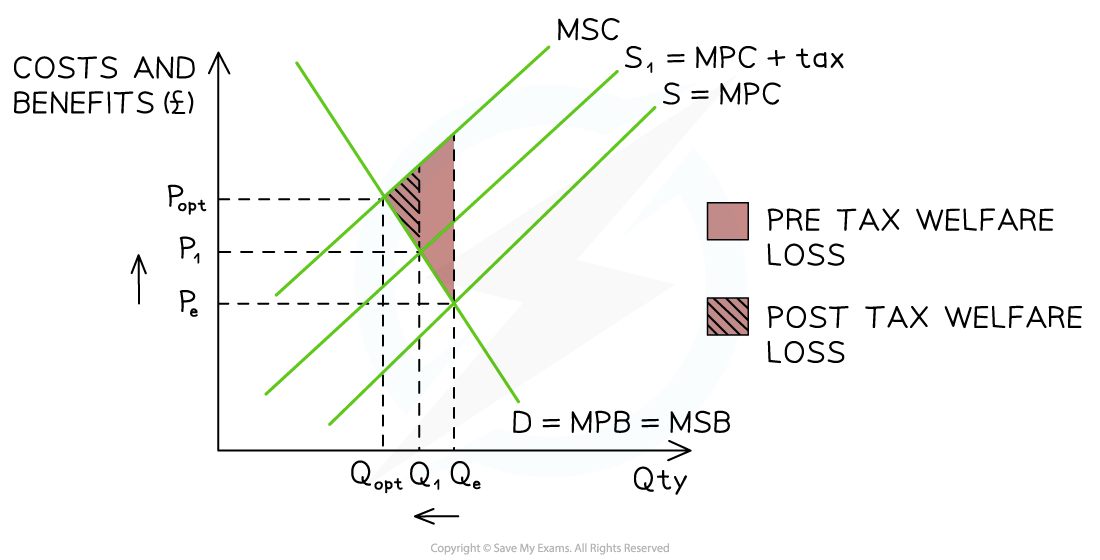
A diagram that shows the impact of a tax on a product that is over-provided in society. The tax reduces the welfare loss and moves production closer to the optimum level of production
Diagram Analysis
- The?free-market?equilibrium is at PeQe?- where?MSB = MPC
- Market failure exists as?MSC > MSB?at equilibrium
- Optimum level of output is at?Qopt
- There is?over-provision?of this product
- A?specific tax?shifts the supply curve left from?S → S1
- The tax does not completely eradicate the welfare loss but?moves the market closer?to the optimum level of output (Qopt)
- The?welfare loss has been reduced?as shown in the diagram
- The?new?market equilibrium is at?P1Q1
- This is a?higher price?and?less output
- There is less?over-provision?and so less market failure
- The?external costs?have been reduced
Specific Tax on Negative Externality of Consumption
- Governments frequently tax?demerit goods?such as cigarettes, alcohol, fatty foods, and polluting vehicles
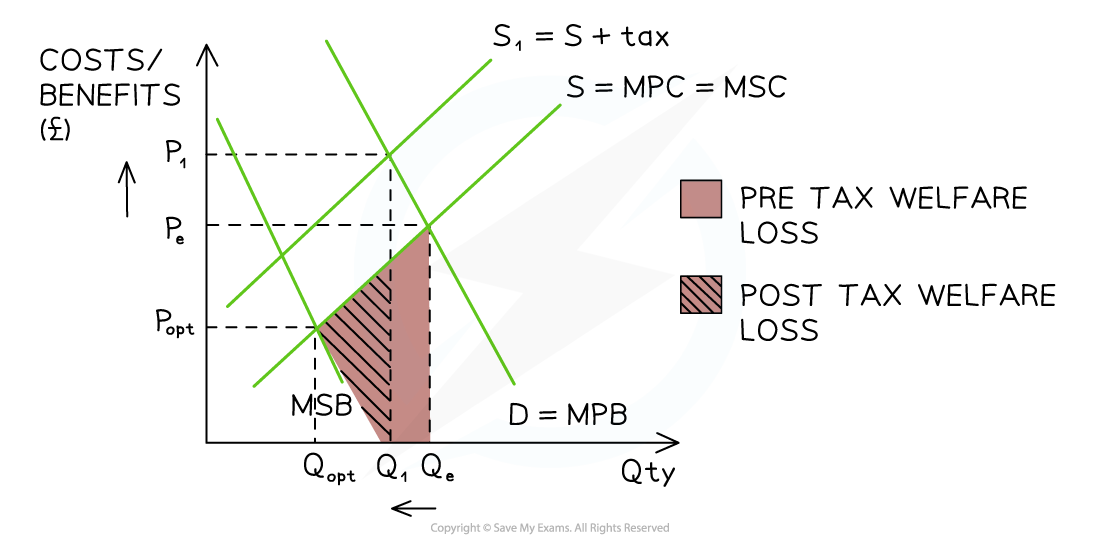
A diagram that shows the impact of a tax on a product that is over-consumed in society. The tax reduces the welfare loss and moves consumption closer to the optimum level of production
Diagram Analysis
- The?free-market?equilibrium is at PeQe?- where?MPB = MSC
- Market failure exists as?MSC > MSB?at equilibrium
- Optimum level of consumption is at?Qopt
- There is?over-consumption?of this product
- A?specific tax?shifts the supply curve left from?S → S1
- The tax does not completely eradicate the welfare loss but?moves the market closer?to the optimum level of output?(Qopt)
- The?welfare loss has been reduced?as shown in the diagram
- The?new?market equilibrium is at?P1Q1
- This is a?higher price?and?lower output
- There is less?over-consumption?and so less market failure
- The?external costs?have been reduced
Subsidies
- Governments frequently use subsidies to encourage production/consumption of?merit goods?such as energy efficient products, electric vehicles, healthcare, and education
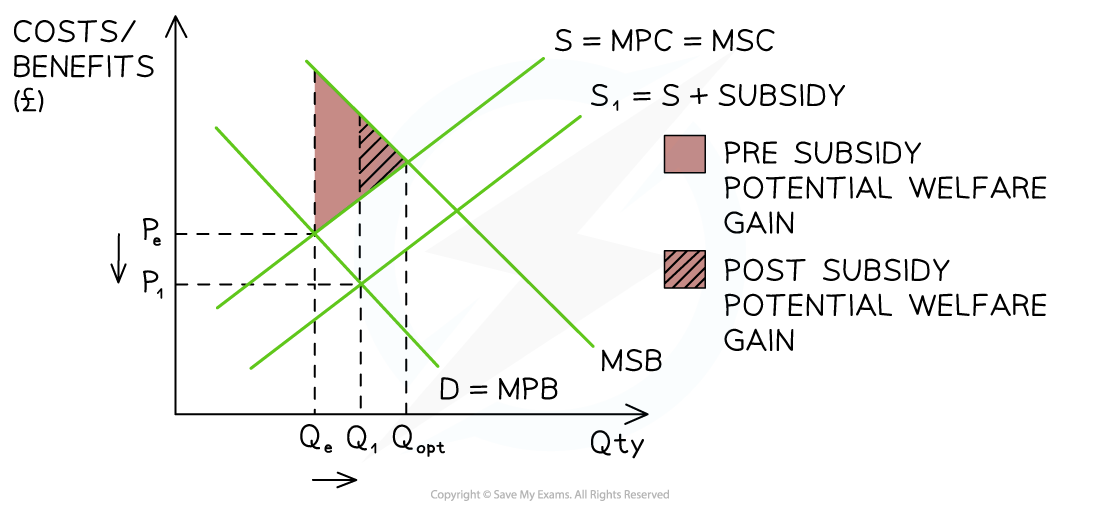
A diagram that shows the impact of a subsidy on a product that is under-consumed in society. The subsidy reduces the potential welfare gain and moves consumption closer to the optimum level
Diagram Analysis
- The?free-market?equilibrium is at PeQe?- where?MPB = MSC
- Market failure exists as?MSB > MSC?at equilibrium
- Optimum level of output is at?Qopt
- There is?under-consumption?of this product
- A?subsidy?shifts the supply curve right from?S → S1
- It does not completely eradicate the potential welfare gain but?moves the market closer?to the optimum level of output (Qopt)
- The?potential?welfare gain has been reduced?as shown in the diagram
- The?new?market equilibrium is at?P1Q1
- This is a?lower price?and?higher output
- There is less?under-consumption?and so less market failure
- Some of the?external benefits available have been realised
Maximum Prices
- Governments will often use?maximum prices?in order to help?consumers.?Sometimes they are used for?long periods?of time e.g. housing rental markets. Other times they are?short-term solutions?to unusual price increases e.g. petrol
- A?maximum price?is set by the government?below?the existing?free market equilibrium price?and sellers cannot legally sell the good/service at a higher price
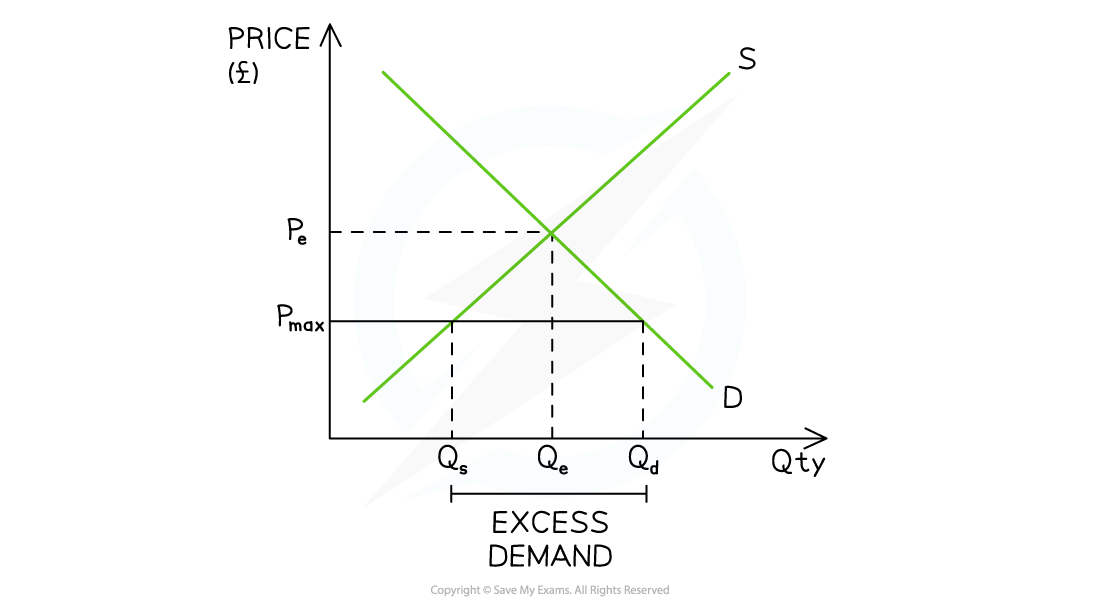
A diagram that shows the imposition of a maximum price (Pmax) which sits below the free market price (Pe) and creates a condition of excess demand (shortage)
Diagram Analysis
- Initial?market equilibrium?is at PeQe
- A?maximum price?is imposed at?Pmax
- The lower price?reduces the incentive to supply?and there is contraction in QS from Qe?→ Qs
- The lower price increases the incentive to consume?and there is an extension in QD from Qe?→ Qd
- This creates a condition of?excess demand QsQd
- Some consumers benefit?as they purchase at lower prices
- Others are unable to purchase due to the shortage
- This unmet demand usually encourages the creation of illegal markets (black/grey markets)
Minimum Prices
- Governments will often use?minimum prices?in order to?help producers?or to?decrease consumption of a demerit good?e.g. alcohol
- A?minimum price?is set by the government?above?the existing?free market equilibrium price?and sellers cannot legally sell the good/service?at a lower price
- Minimum prices are also used in the?labour market to protect workers?from wage exploitation. These are called?minimum wages
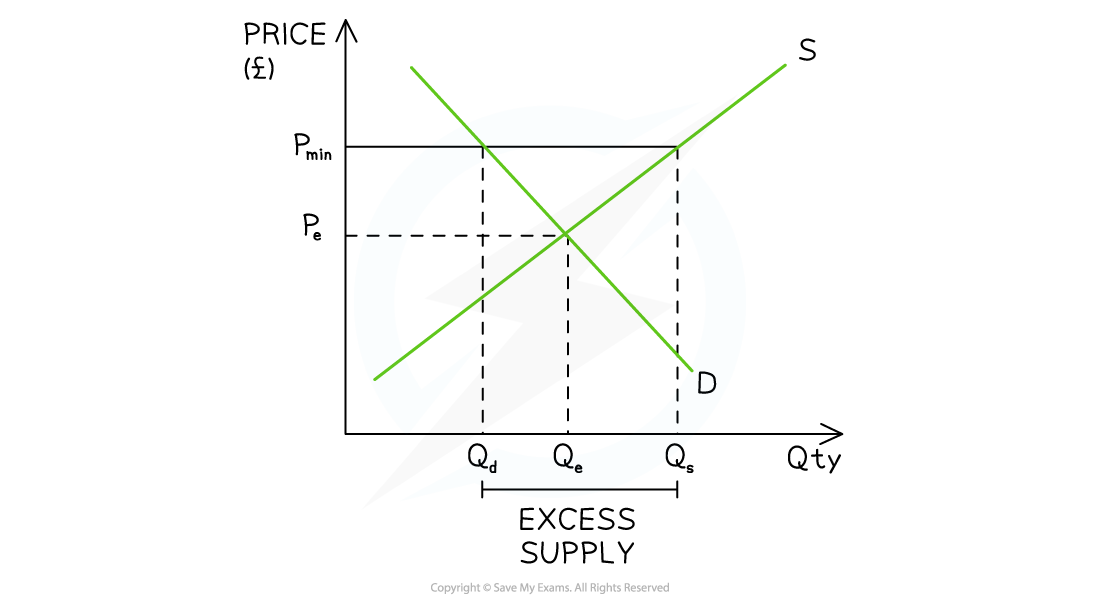
A diagram that shows the imposition of a minimum price (Pmin) which sits above the free market price (Pe) and creates a condition of excess supply (surplus)
Diagram Analysis
- Initial?market equilibrium?is at PeQe
- A?minimum price?is imposed at?Pmin
- The higher price?increases the incentive to supply?and there is an extension in QS from Qe?→ Qs
- The higher price decreases?the incentive to consume?and there is a contraction in QD from Qe?→ Qd
- This creates a condition of?excess supply QdQs
Differences in Government Responses to the Excess Supply
- In agricultural markets,?if a minimum price is set by the government?producers benefit as they receive a higher price
- Governments will often purchase the?excess supply?and export it
- In demerit markets,?producers suffer as QD contracts
- Governments will not purchase the?excess supply
- Producers?usually?lower their output?in the market to match the QD at the minimum price
Other Methods of Government Intervention
Trade Pollution Permits
- Governments create a?pollution permit market?and issue permits to polluting firms
- This helps to reduce?negative externalities?of production
- Each permit is typically valid for the emission of?one ton of pollutant
- More polluting firms have to?buy additional permits?from less polluting firms
- The price of the permit represents an additional cost of production
- If the price of additional permits is more than the?cost of investing?in new pollution technology, firms will be incentivised to switch to?cleaner technology:
- Firms can then?sell their spare permits?and gain additional revenue
State Provision of Public Goods
- Public goods are?beneficial for society?and are?not provided by private firms?due to the?free rider problem
- They are usually provided?free at the point of consumption, but are paid for through?general taxation
- Examples include roads, parks, lighthouses, national defence
Provision of Information
- Information gaps?cause market failure
- Governments can set up?information portals?so as to reduce the?asymmetric information
- Examples include job centres, consumer rights websites, nutritional labels
Regulation
- Governments?create rules?to limit harm from?negative externalities?of consumption/production
- They create?regulatory agencies?to monitor that the rules are not broken
- There are more than?90 regulators?in the UK
- Individuals or firms may be?fined/imprisoned?for breaking the rules
- Examples of some industry regulators include the Environment Agency, Ofsted, and the Financial Conduct Authority
轉載自savemyexams
以上就是關于【Edexcel A Level Economics A:復習筆記1.4.1 Government Intervention in Markets】的解答,如需了解學校/賽事/課程動態,可至翰林教育官網獲取更多信息。
往期文章閱讀推薦:
2026 ALEVEL 夏考A率出爐!愛德思vs牛津AQA,哪些科目真的“好出分”?
2026 AMC10/12美國數學競賽新賽季!【翰林教育 × 清華大學出版社】獨家教材全面發售!


翰林AMC8視頻課重磅上線!

國際競賽真題資源免費領取






