CIE A Level Maths: Probability & Statistics 1復習筆記1.1.2 Frequency Tables

Frequency Tables
In most cases in your statistics course, you will come across data that is presented in a?frequency table. These allow data to be summarised and make them easier to work with.
Ungrouped Data
A frequency table for?ungrouped data?shows the frequency of?individual data values
Why use a frequency table for ungrouped data?
- When collecting large amounts of raw data, it is quicker to use a tally system and then collate the results into a frequency table
- Ungrouped frequency tables are normally used for?numerical, discrete data
- Organising data into a frequency table makes it easier to work with
- Calculating averages, ranges and summary statistics can be done much quicker from a frequency table than from raw data
- It gives a clear?pattern?of the data
- It is easy to quickly see where most of the data are and to see extreme values
- A frequency table for ungrouped data keeps all of the original data values
- It is still possible to calculate the actual averages, ranges and summary statistics
How are mean, median and mode calculated from an ungrouped frequency table?
- You should already be familiar with finding the mean, median and mode from raw, ungrouped data
- The?mode?is the value that occurs?most often?in a data set
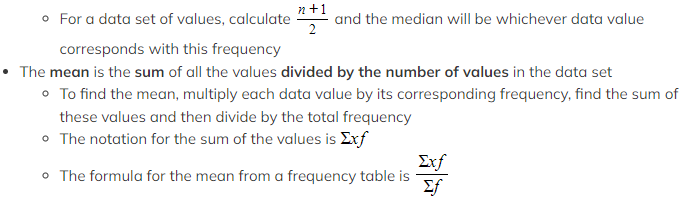
- In an ungrouped frequency table the?data value?with the?highest frequency?will be the mode
- The?median?is the?middle?value when the data is in?order of size
- To find the median from an ungrouped frequency table, add the frequencies together until you reach the value that is half of the total
 Worked Example
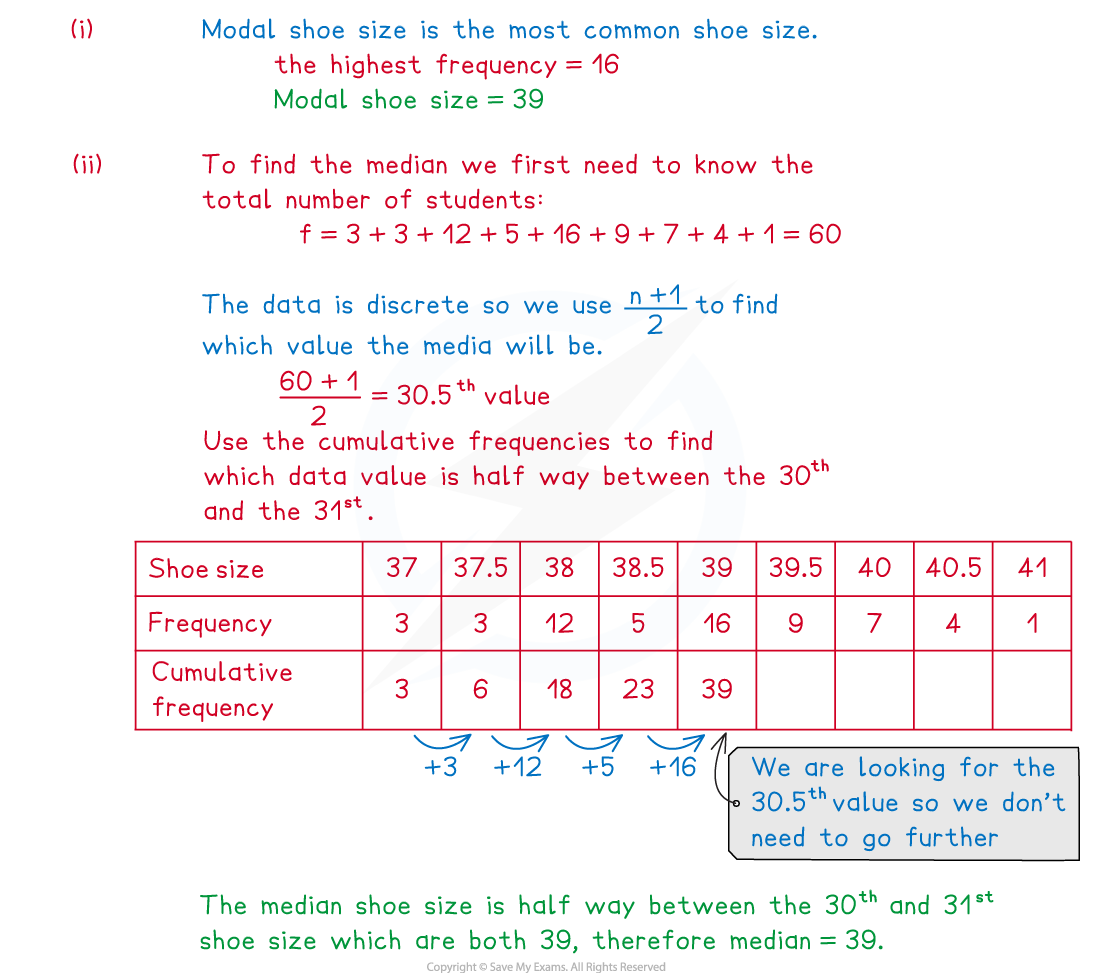
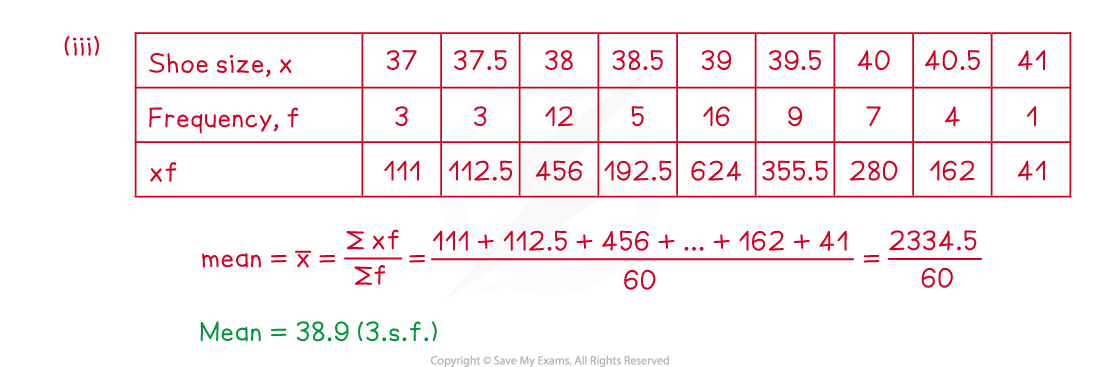
The frequency table below gives information about the shoe size of a group of year 12 students.
| Shoe Size | 37 | 37.5 | 38 | 38.5 | 39 | 39.5 | 40 | 40.5 | 41 |
| Frequency | 3 | 3 | 12 | 5 | 16 | 9 | 7 | 4 | 1 |
Exam Tip
- Use common sense when checking your answers, is your mean within the range of the data? Does is seem right? A mean of 140 for example could not be correct if the data is about ages of students taking an exam at university.
Grouped Data
A frequency table for?grouped data?is usually used for large amounts of?continuous data.?They shows the frequency of?data values?that are within a particular?group?or?class.
What are the advantages and disadvantages of grouping data?
- Grouping data is especially useful when data can take a large range of different values
- Trends and patterns can be easily spotted when data has been grouped
- Calculations are much quicker with data that has been grouped
- It is important to be aware, however, that grouped frequency tables also have some negatives
- The actual data values are lost when data is grouped
- It is only possible to calculate estimated averages, ranges and summary statistics
Notation for grouped frequency tables
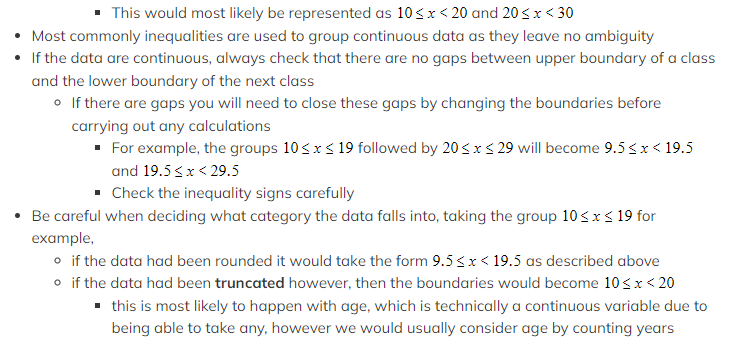
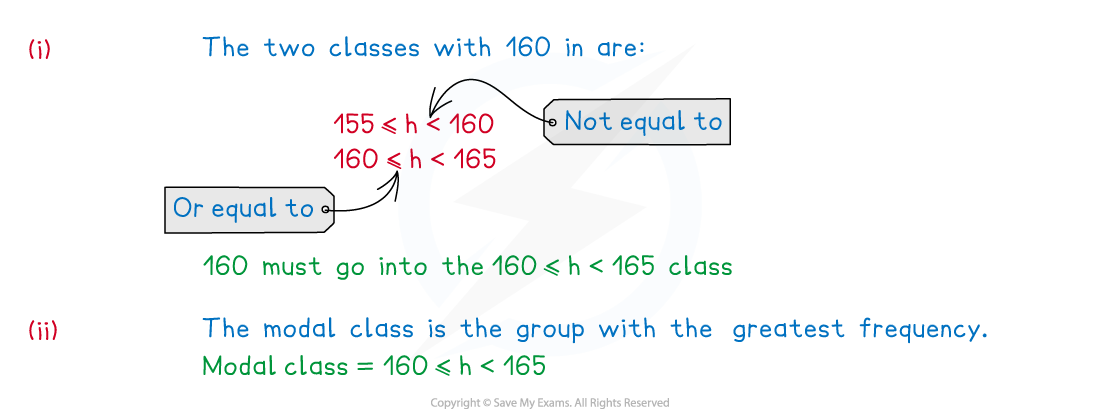
- When grouping data, it is important to be clear about which?group?or?class?any data value should be entered into
- A group entry of 10 – 20 followed by 20 – 30 would be unclear because the number 20 could be entered into both groups
- If the data are discrete, this could be written as 10 – 19 and 20 – 29
- For continuous data, this could be changed to 10 – and 20 –
- A group entry of 10 – 20 followed by 20 – 30 would be unclear because the number 20 could be entered into both groups
 Finding averages from grouped frequency tables
- Instead of finding the?mode, when working with a grouped frequency table we instead find the?modal class
- This will be the?class?(group) with the?greatest frequency
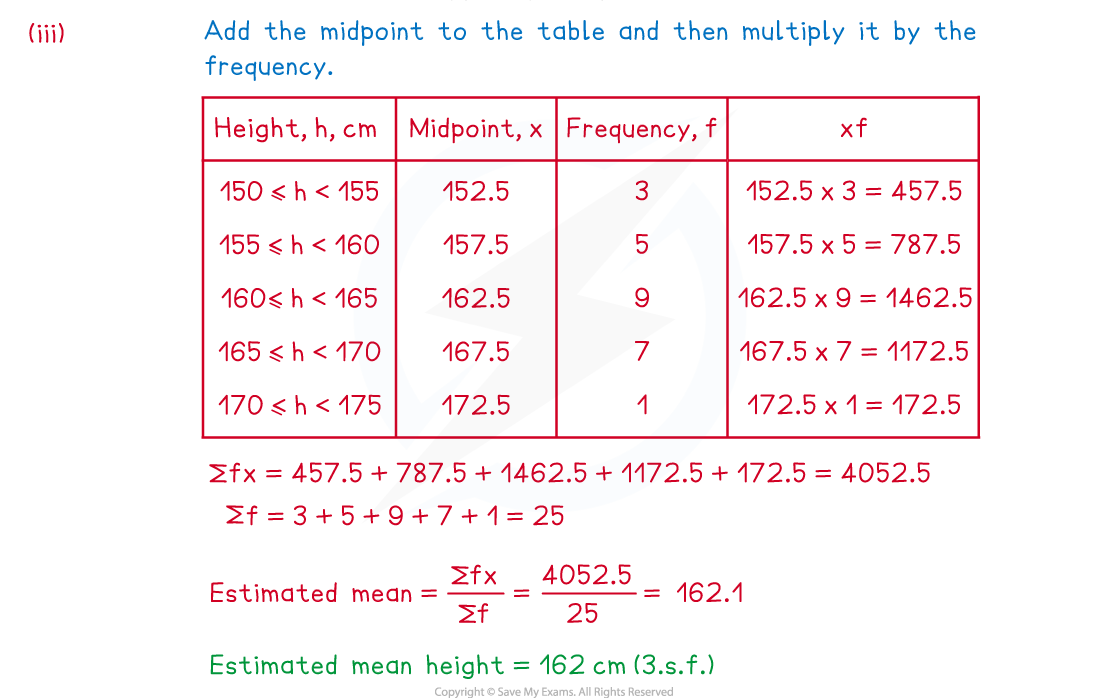
- It is only possible to calculate an?estimate?for the?mean?and the?median?from a grouped frequency table
- Calculating the?estimated mean?is the same as for ungrouped frequency tables, however you will need to find the?midpoints?first
- the midpoint is the mean of the upper and lower values in the class boundaries
 Calculating the?estimated median?is more complicated?and questions will only ask for the class that the estimated median would be in
Worked Example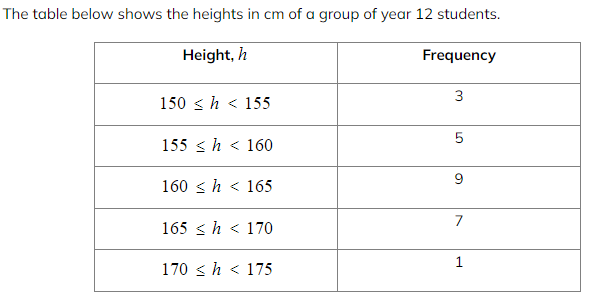 (i)Write down the class that a student of exactly 160 cm should be added to.
Exam Tip
- There can be a lot of calculations when working with grouped frequency tables, be extra careful when using your calculators as it is easy to make small errors with these questions. Use the table and add information to the table as you go as there will be marks available for showing work within the methods.
轉載自savemyexams
以上就是關于【CIE A Level Maths: Probability & Statistics 1復習筆記1.1.2 Frequency Tables】的解答,如需了解學校/賽事/課程動態,可至翰林教育官網獲取更多信息。
往期文章閱讀推薦:
2026 ALEVEL 夏考A率出爐!愛德思vs牛津AQA,哪些科目真的“好出分”?
2026 AMC10/12美國數學競賽新賽季!【翰林教育 × 清華大學出版社】獨家教材全面發售!


翰林AMC8視頻課重磅上線!

國際競賽真題資源免費領取






