CIE A Level Physics復(fù)習(xí)筆記19.1.4 Area Under a Potential-Charge Graph

Area Under a Potential–Charge Graph
- When charging a capacitor, the power supply pushes electrons from the positive to the negative plate
- It therefore does?work?on the electrons, which increase their?electric potential energy
- At first, a small amount of charge is pushed from the positive to the negative plate, then gradually, this builds up
- Adding more electrons to the negative plate at first is relatively easy since there is little repulsion
- As the charge of the negative plate increases ie. becomes more negatively charged, the force of repulsion between the electrons on the plate and the new electrons being pushed onto it increases
- This means a greater amount of work must be done to increase the charge on the negative plate or in other words:
The potential difference V across the capacitor increases as the amount of charge Q increases
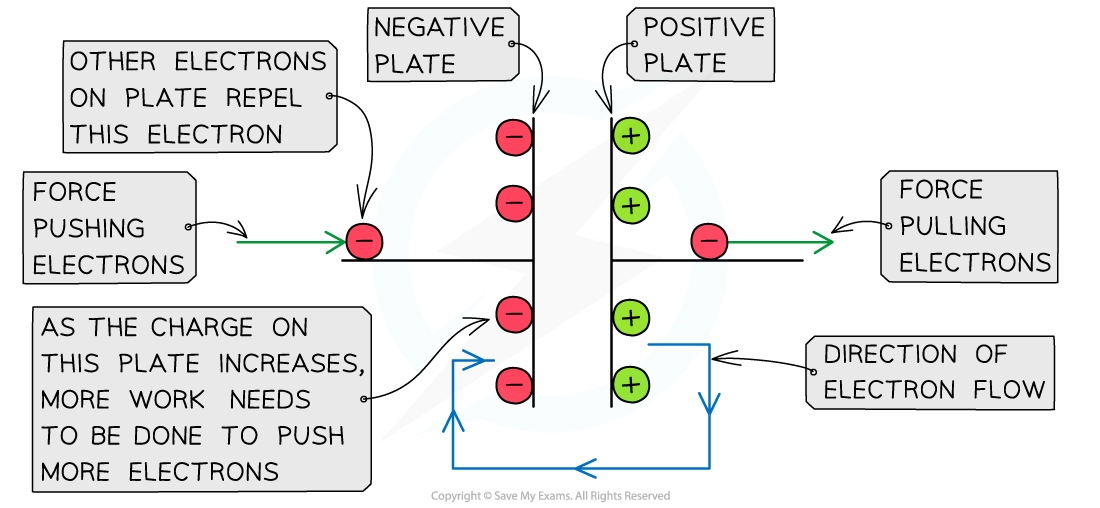
As the charge on the negative plate builds up, more work needs to be done to add more charge
- The charge?Q?on the capacitor is?directly proportional?to its potential difference?V
- The graph of charge against potential difference is therefore a straight line graph through the origin
- The electric potential energy stored in the capacitor can be determined from the?area under the potential-charge graph?which is equal to the area of a right-angled triangle:

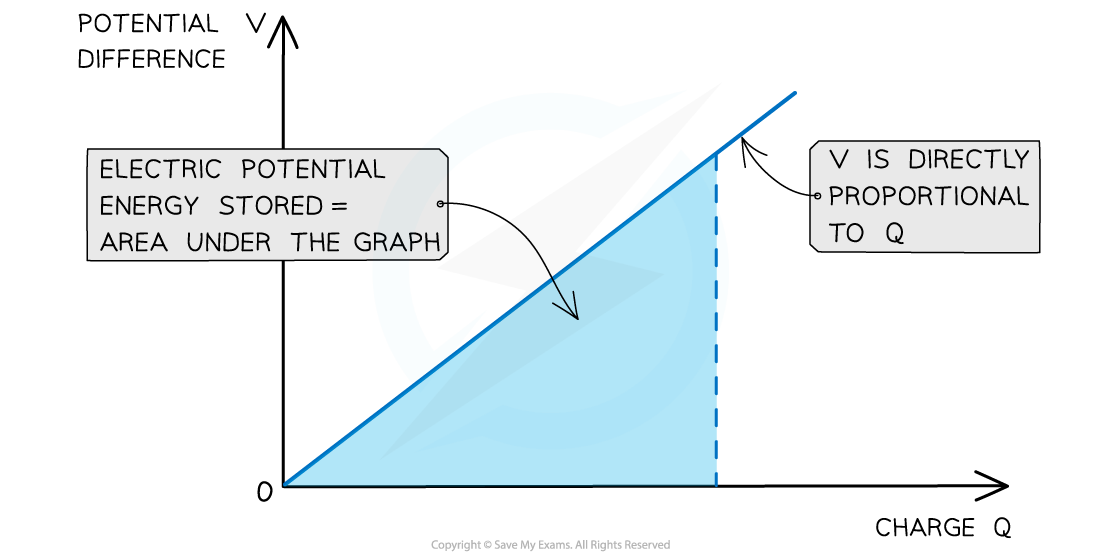
The electric potential energy stored in the capacitor is the area under the potential-charge graph
Worked Example
The variation of the potential?V?of a charged isolated metal sphere with surface charge?Q?is shown on the graph below.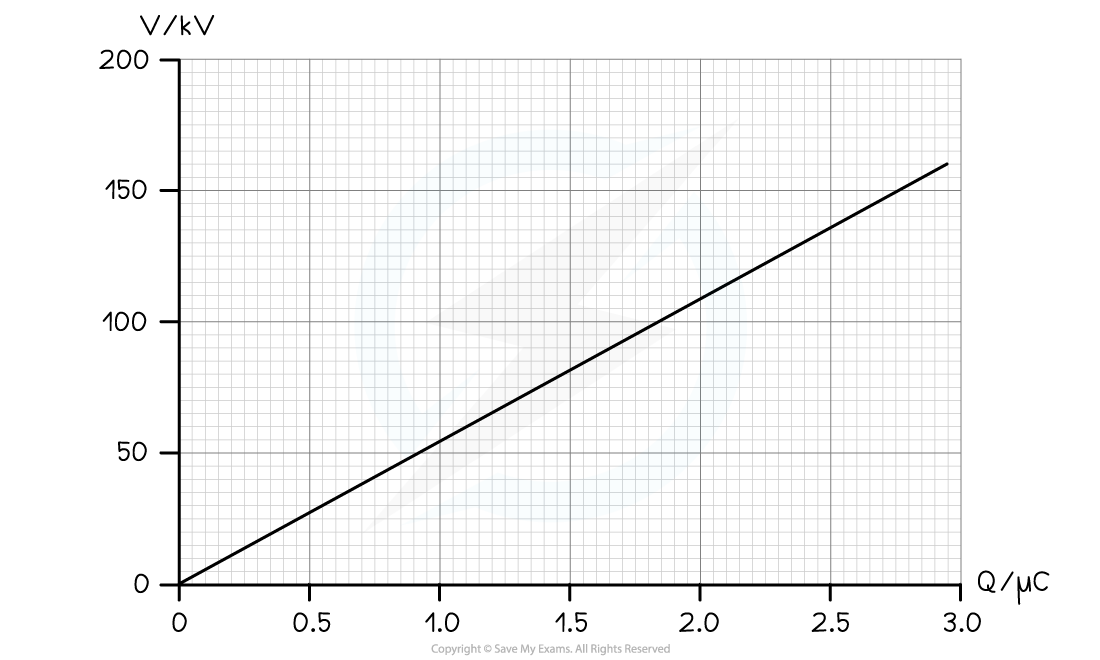
Using the graph, determine the electric potential energy stored on the sphere when charged to a potential of 100 kV.
Step 1: Determine the charge on the sphere at the potential of 100 kV
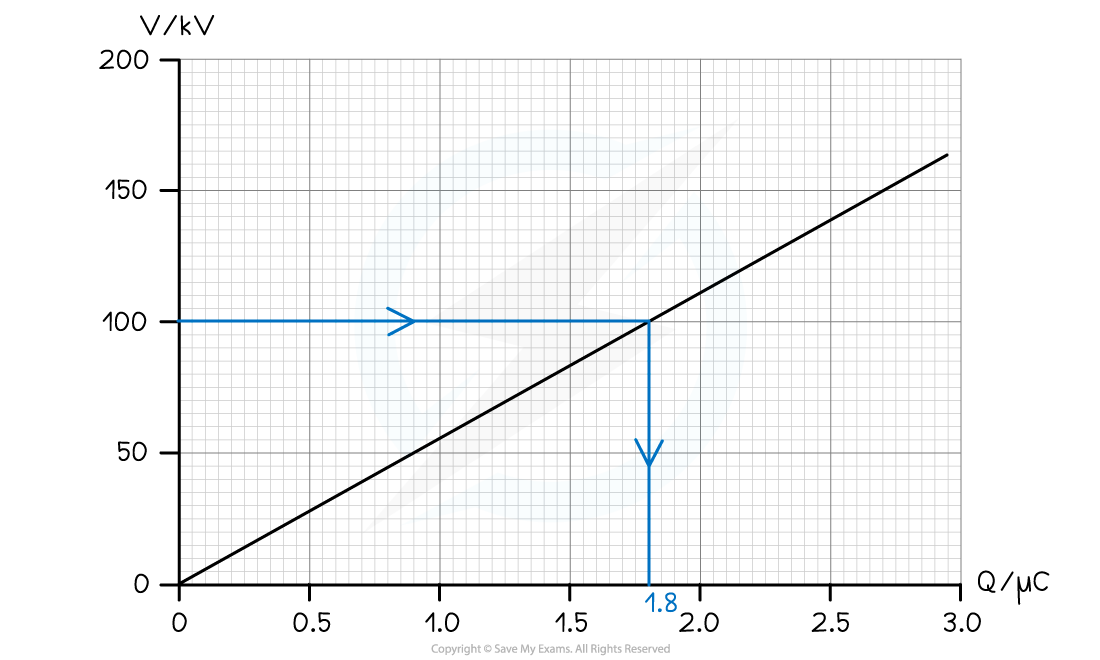
-
- From the graph, the charge on the sphere at 100 kV is?1.8 μC
Step 2: Calculate the electric potential energy stored
-
- The electric potential energy stored is the area under the graph at 100 kV
- The area is equal to a right-angled triangle, so, can be calculated with the equation:

-
- Substituting in the values gives:


Exam Tip
Remember to always check the?units?of the charge–potential difference graphs. The charges can often be in μC or the potential difference in kV! The units must be in C and V to get a work done in J.
轉(zhuǎn)載自savemyexams
以上就是關(guān)于【CIE A Level Physics復(fù)習(xí)筆記19.1.4 Area Under a Potential-Charge Graph】的解答,如需了解學(xué)校/賽事/課程動(dòng)態(tài),可至翰林教育官網(wǎng)獲取更多信息。
往期文章閱讀推薦:
2026 ALEVEL 夏考A率出爐!愛德思vs牛津AQA,哪些科目真的“好出分”?
2026 AMC10/12美國數(shù)學(xué)競賽新賽季!【翰林教育 × 清華大學(xué)出版社】獨(dú)家教材全面發(fā)售!


翰林AMC8視頻課重磅上線!

國際競賽真題資源免費(fèi)領(lǐng)取






