CIE A Level Physics復習筆記17.2.2 Resonance

Resonance
- In order to sustain oscillations in a simple harmonic system, a periodic force must be applied to replace the energy lost in?damping
- This periodic force?does work?on the resistive force decreasing the oscillations
- These are known as?forced oscillations, and are defined as:
Periodic forces which are applied in order to sustain oscillations
- For example, when a child is on a swing, they will be pushed at one end after each cycle in order to keep swinging and prevent air resistance from damping the oscillations
- These extra pushes are the forced oscillations, without them, the child will eventually come to a stop
- The frequency of forced oscillations is referred to as the?driving frequency?(f)
- All oscillating systems have a?natural frequency (f0), this is defined as:
The frequency of an oscillation when the oscillating system is allowed to oscillate freely
- Oscillating systems can exhibit a property known as?resonance
- When resonance is achieved, a maximum amplitude of oscillations can be observed
- Resonance is defined as:
When the driving frequency applied to an oscillating system is equal to its natural frequency, the amplitude of the resulting oscillations increases significantly
- For example, when a child is pushed on a swing:
- The swing plus the child has a fixed natural frequency
- A small push after each cycle increases the amplitude of the oscillations to swing the child higher
- If the driving frequency does not quite match the natural frequency, the amplitude will increase but not to the same extent at when resonance is achieved
- This is because at resonance, energy is transferred from the driver to the oscillating system?most efficiently
- Therefore, at resonance, the system will be transferring the maximum kinetic energy possible
- A graph of driving frequency?f?against amplitude?a?of oscillations is called a?resonance curve. It has the following key features:
- When f < f0, the amplitude of oscillations increases
- At the peak where f = f0, the amplitude is at its maximum. This is?resonance
- When f > f0, the amplitude of oscillations starts to decrease
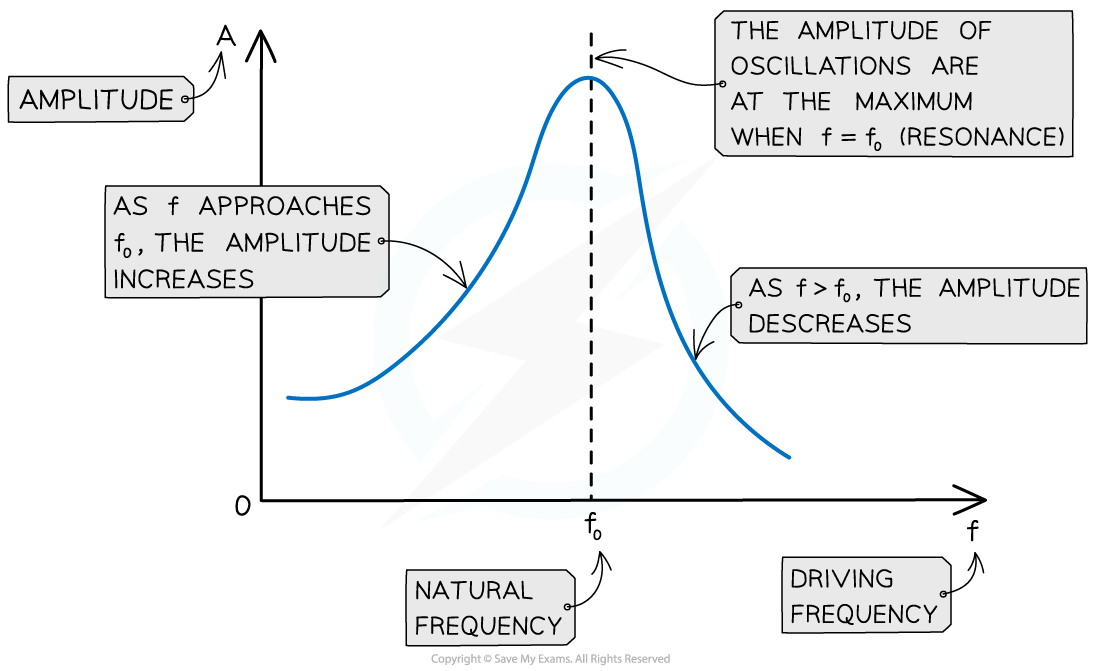
The maximum amplitude of the oscillations occurs when the driving frequency is equal to the natural frequency of the oscillator
- Damping reduces the amplitude of resonance vibrations
- The height and shape of the resonance curve will therefore change slightly depending on the degree of damping
- Note:?the natural frequency?f0?will remain the same
- As the degree of damping is increased, the resonance graph is altered in the following ways:
- The amplitude of resonance vibrations decrease, meaning the peak of the curve lowers
- The resonance peak broadens
- The resonance peak moves slightly to the left of the natural frequency when heavily damped
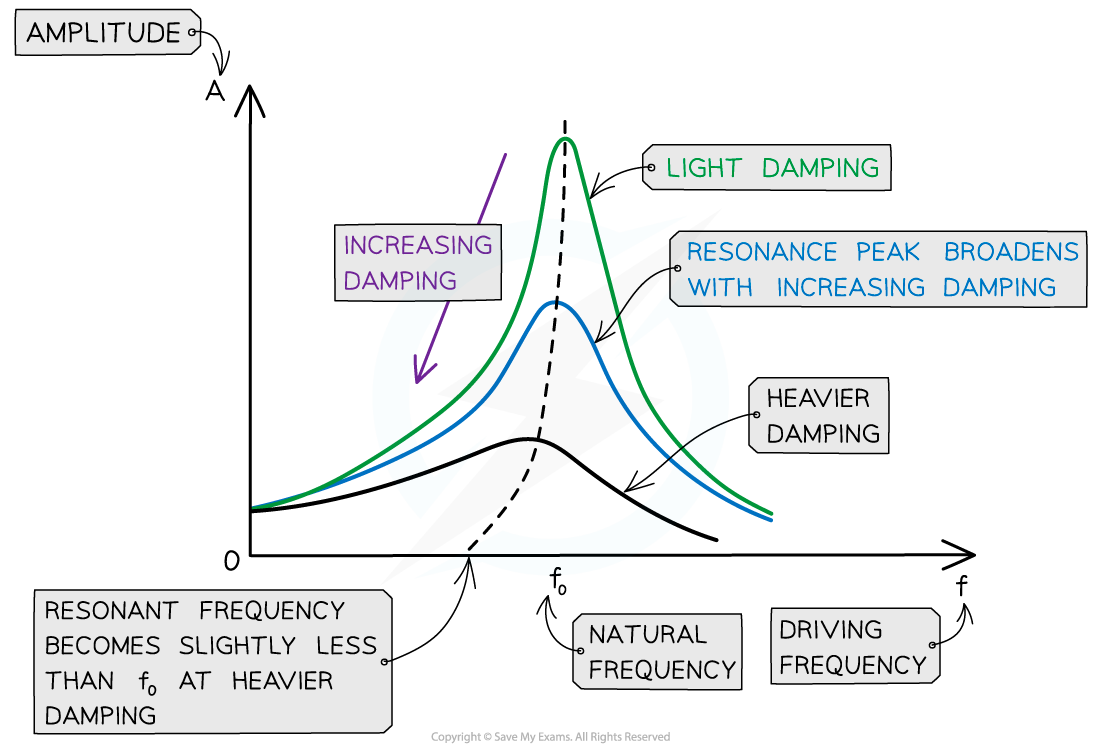
As damping is increased, resonance peak lowers, the curve broadens and moves slightly to the left
轉載自savemyexams

國際競賽真題資源免費領取


美高學分項目重磅來襲!立即了解