CIE A Level Physics復習筆記17.1.5 SHM Graphs

SHM Graphs
- The displacement, velocity and acceleration of an object in?simple harmonic motion?can be represented by graphs against time
- All undamped SHM graphs are represented by?periodic functions
- This means they can all be described by sine and cosine curves
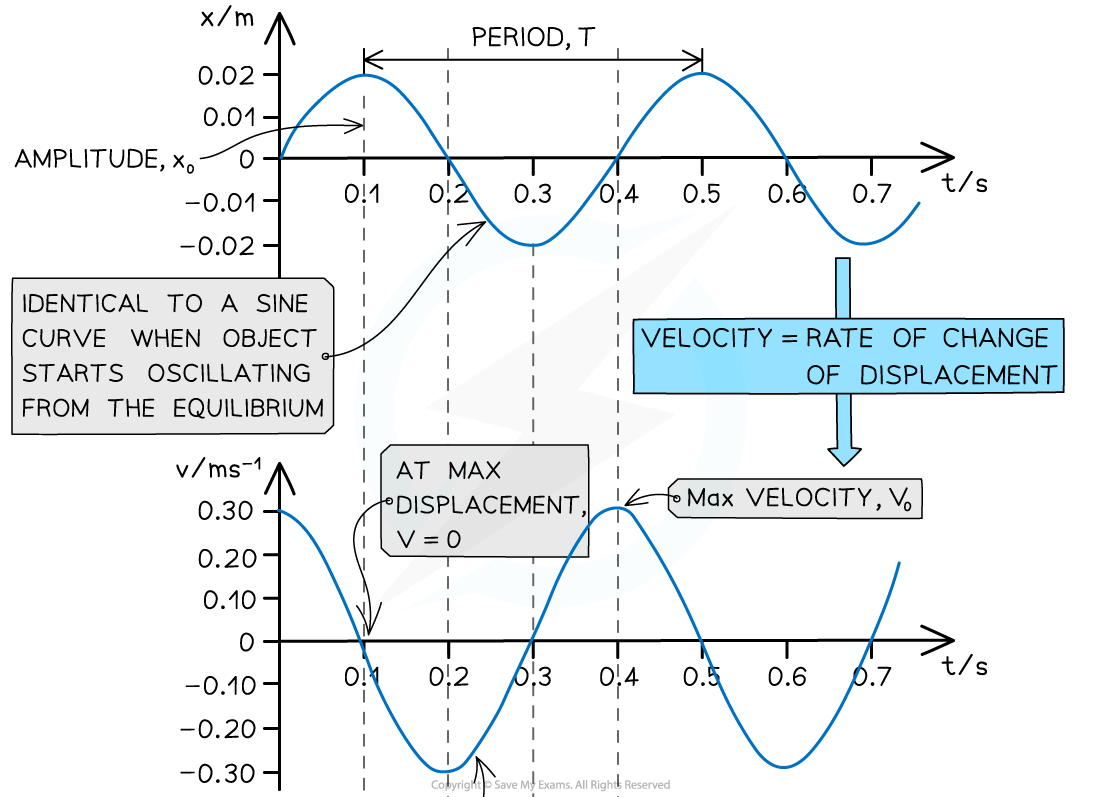
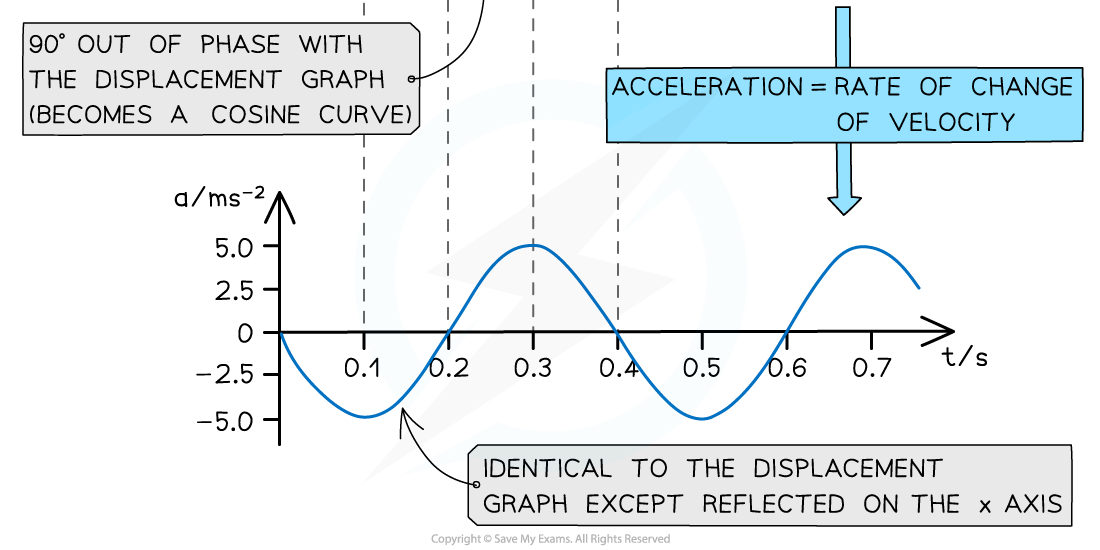
The displacement, velocity and acceleration graphs in SHM are all 90° out of phase with each other
- Key features of the displacement-time graph:
- The?amplitude?of oscillations?x0?can be found from the maximum value of?x
- The?time period?of oscillations?T?can be found from reading the time taken for one full cycle
- The graph might not always start at 0
- If the oscillations starts at the positive or negative amplitude, the displacement will be at its maximum
- Key features of the velocity-time graph:
- It is 90o?out of phase with the displacement-time graph
- Velocity is equal to the rate of change of displacement
- So, the velocity of an oscillator at any time can be determined from the?gradient of the displacement-time graph:

-
- An oscillator moves the fastest at its equilibrium position
- Therefore, the velocity is at its?maximum?when the?displacement is zero
- Key features of the acceleration-time graph:
- The acceleration graph is a reflection of the displacement graph on the x axis
- This means when a mass has positive displacement (to the right) the acceleration is in the opposite direction (to the left) and vice versa
- It is 90o?out of phase with the velocity-time graph
- Acceleration is equal to the rate of change of velocity
- So, the acceleration of an oscillator at any time can be determined from the?gradient of the velocity-time graph:

-
- The maximum value of the acceleration is when the oscillator is at its?maximum displacement
Worked Example
A swing is pulled 5 cm and then released.The variation of the horizontal displacement?x?of the swing with time t is shown on the graph below.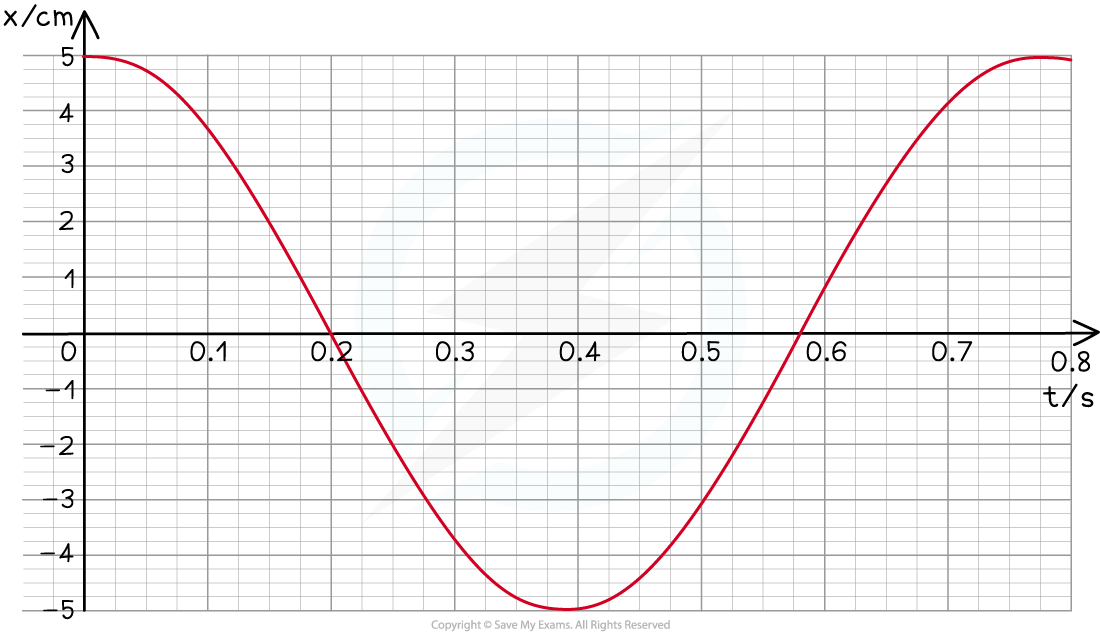
The swing exhibits simple harmonic motion.Use data from the graph to determine at what time the velocity of the swing is first at its maximum.
Step 1:?The velocity is at its maximum when the displacement x = 0
Step 2:?Reading value of time when x = 0
From the graph this is equal to 0.2 s
Exam Tip
These graphs might not look identical to what is in your textbook, depending on where the object starts oscillating from at t = 0 (on either side of the equilibrium, or at the equilibrium). However, if there is no damping, they will all always be a general sine or cosine curves.
轉載自savemyexams
以上就是關于【CIE A Level Physics復習筆記17.1.5 SHM Graphs】的解答,如需了解學校/賽事/課程動態,可至翰林教育官網獲取更多信息。
往期文章閱讀推薦:
2026 ALEVEL 夏考A率出爐!愛德思vs牛津AQA,哪些科目真的“好出分”?
2026 AMC10/12美國數學競賽新賽季!【翰林教育 × 清華大學出版社】獨家教材全面發售!


翰林AMC8視頻課重磅上線!

國際競賽真題資源免費領取






