IB DP Physics: SL復習筆記3.2.5 Investigating Gas Laws

Investigating Gas Laws
Investigating Gay-Lussac's Law
Aim of the Experiment
- The aim of the experiment is to investigate the relationship between the pressure and the temperature of a gas at constant volume
Variables
- Independent variable?= pressure,?p?(Pa)
- Dependent variable?= temperature, T (°C)
- Control variables:
- Volume of the gas
- Temperature of the room
Equipment List
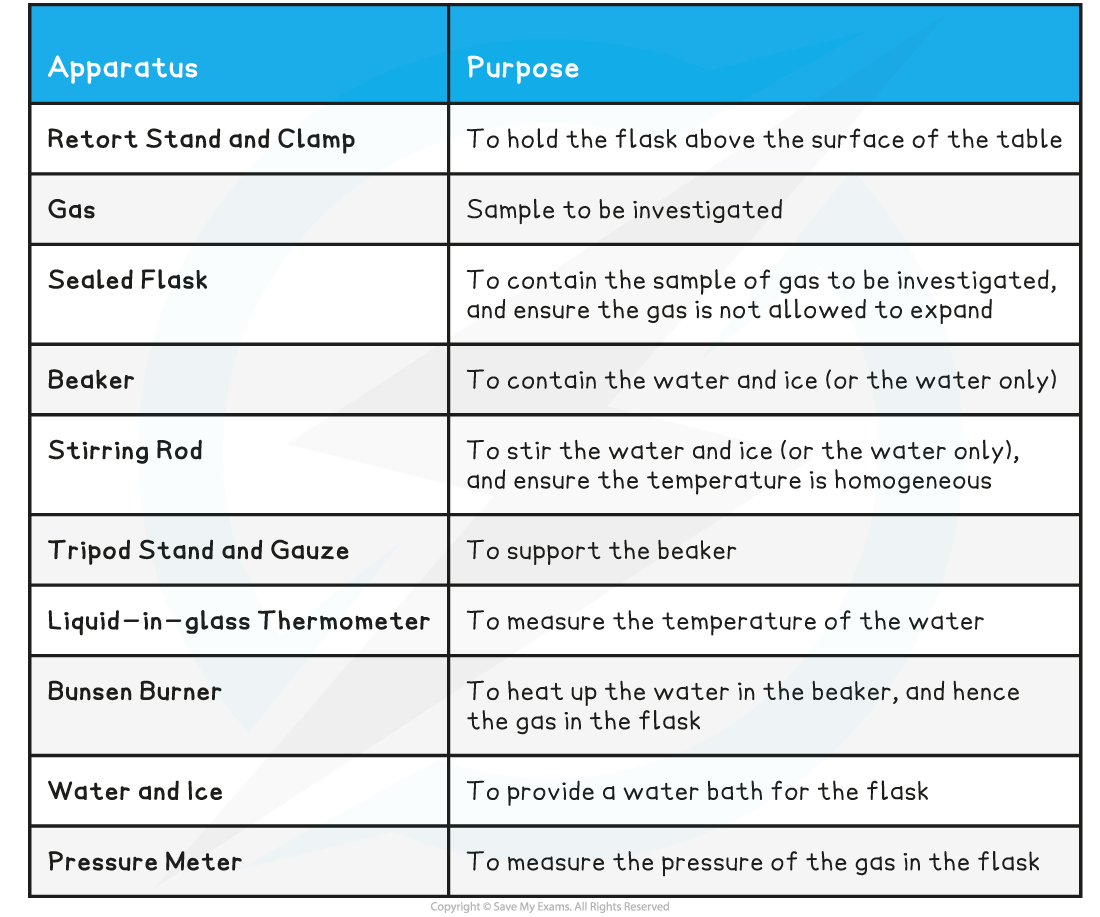
- Resolution?of measuring equipment:
- Beaker = 50 ml
- Liquid-in-glass thermometer = 1°C
- Pressure meter = 0.001 × 10⁵?Pa
Method
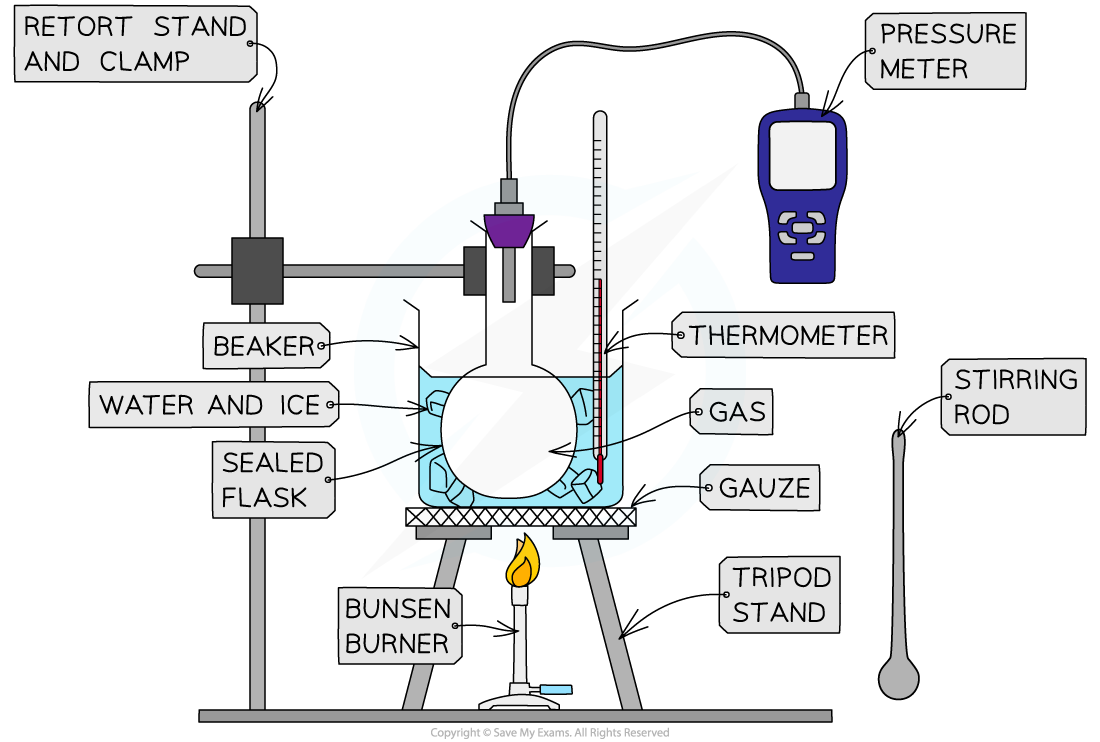
Apparatus used to investigate the relationship between the pressure and the temperature of a gas at constant volume
- Set up the apparatus as shown in the diagram
- Pour 500 ml of ice and water into the beaker, and stir it with the stirring rod
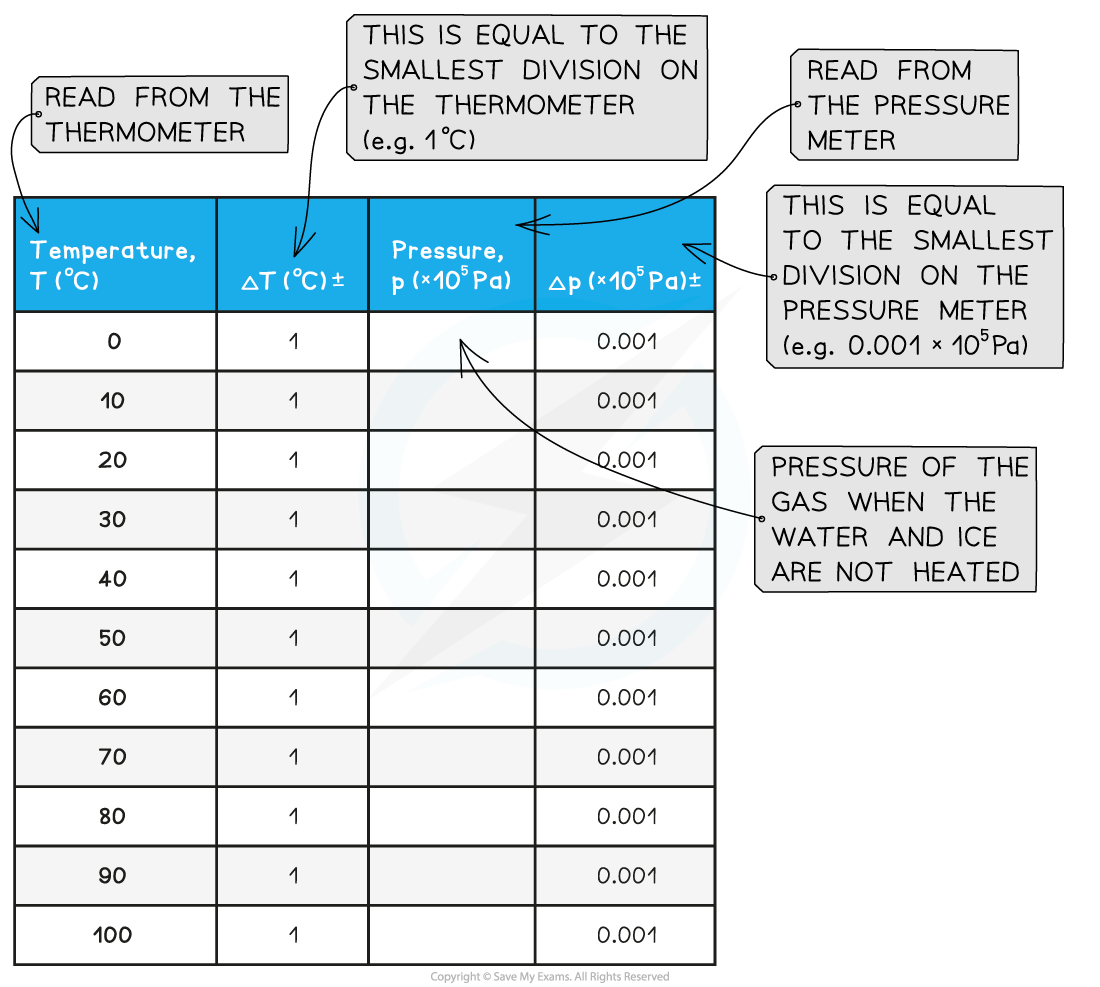
- Measure the temperature?T?of the water and record this value in the table, together with its uncertainty?ΔT
- Measure the pressure?p?of the gas and record this value in the table, together with its uncertainty?Δp
- Light the Bunsen burner and start to heat the water
- Wait until the temperature reading on the thermometer reaches 10°C and measure the pressure of the gas. Record these new values of temperature and pressure in the table
- Keep heating the water and measure the pressure of the gas at increments of 10°C between 0°C and 100°C
- An example of a results table might look like this:
Analysis of Results
- Plot a graph of pressure?p?(Pa) against temperature?T?(°C)
- The y-intercept is the value of the pressure of the gas when the water and ice are not heated (T?= 0°C)
- Extrapolate the graph backwards
- The x-intercept is the value of the temperature of the gas when the pressure is zero
- This refers to the (theoretical) temperature of the gas when the particles would stop moving, corresponding to the absolute zero on the kelvin scale:?T?= 0 K = –273°C
- Verify that the x-intercept corresponds to this value
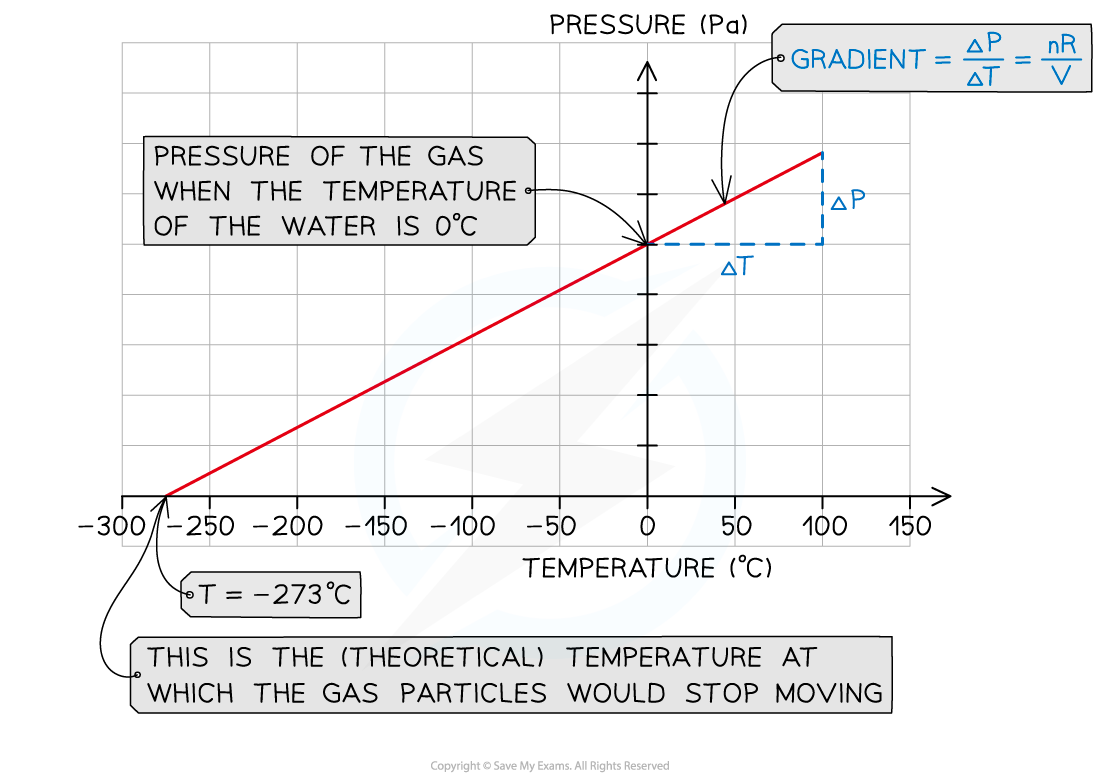
- Calculate the gradient of the graph
- Gradient =?Δp/ΔT
- Recall the?equation of state of ideal gases
- Use this to write the gradient as follows:

- Where:
- n?= number of moles of gas (mol)
- V?= volume of the gas (m3)
- R?= 8.31 J K–1?mol–1(ideal gas constant)
- Using the?volume?V?of the gas sample, and the?number of moles?n, the value of the?ideal gas constant?R?can be calculated
Evaluation
- Parallax error?might affect the temperature readings
- Make sure to hold the thermometer at eye level when taking the temperature readings to reduce random error
- There might be a delay in the responsiveness of the thermometer
- Use a thermometer with a smaller bulb and thinner glass walls to improve its responsiveness
- In this experiment, the temperature of the gas inside the flask is assumed to be the same as the temperature of the water bath, but this might not always be true, as sometimes the reading of pressure might be taken when the gas is not yet in thermal equilibrium with the water in the beaker. The two improvements below ensure the temperature of the gas is much closer to that of the water:
- Cover the beaker with a lid and wrap it in tin foil to reduce thermal energy transfers with the surroundings due to evaporation and convection
- Use a flask with thinner glass walls to improve conduction
- The volume of the gas inside the flask might not be exactly constant due to gaps in the flask's aperture
- Make sure there is no gap between the stopper used to seal the flask and the pressure sensor inserted into it. Seal any small gap with Blu Tack if necessary
Safety Considerations
- Position all equipment away from the edge of the desk
- Tie any long hair back to avoid it catching fire
- Make sure not to spill hot water onto your skin
- Make sure you turn off the gas tap as soon as you finish collecting your data
- Allow time to cool before touching hot parts of the apparatus
Worked Example
A student used an online simulation to investigate Gay-Lussac's law for an ideal gas made of 100 particles, kept at a constant volume.
She obtained the following graph of pressure (kPa) against absolute temperature (K). The gradient of the graph is 4.239 kPa K–1
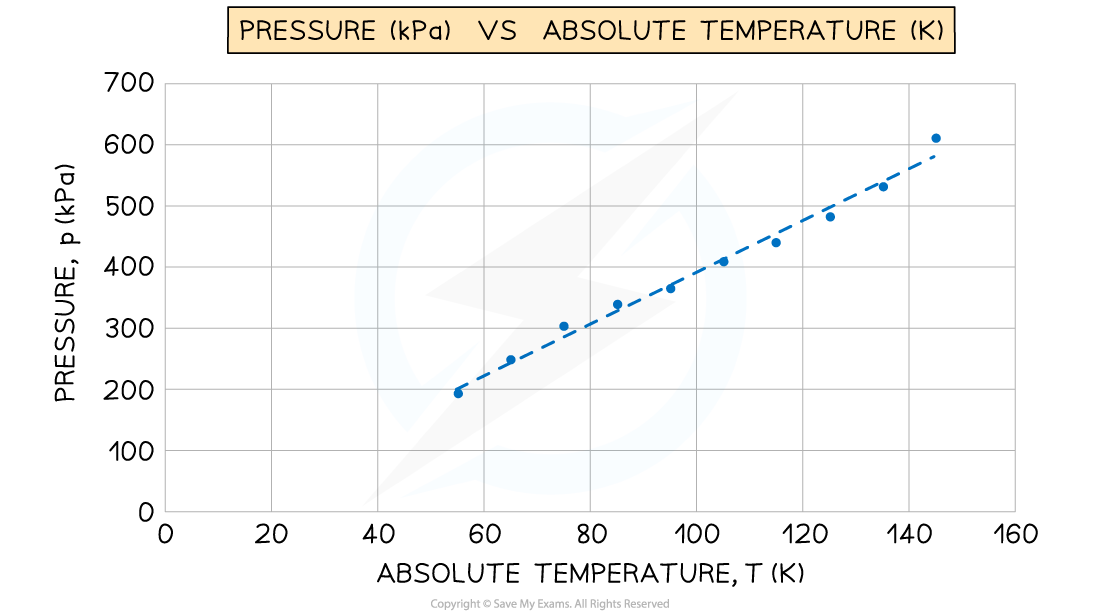
Determine the constant volume of the gas.
Step 1: Write down the known quantities
-
- Gradient?= 4.239 kPa K–1?= 4239 Pa K–1
- Number of gas particles,?N?= 100
Note that you must convert the gradient from kPa K–1?into Pa K–1
Step 2: Calculate the number of moles?n
-
- Write down the relationship between the number of particles?N?and the number of moles,?N = nNA
- Rearrange this to calculate the number of moles?n

-
- Substitute the numbers into the equation for?n
-
-
- From the data booklet,?NA?= 6.02 × 10²³?mol–1
-

n?= 1.7 × 10⁻²²?mol
Step 3: Recall the relationship between the gradient of the graph and the volume of the gas?V
Step 4: Rearrange the above equation to calculate the volume?V

Step 5: Substitute the numbers into the above equation
-
- From the data booklet, R = 8.31 J K–1 mol–1

V?= 3.3 × 10⁻²⁵?m3
轉載自savemyexams
以上就是關于【IB DP Physics: SL復習筆記3.2.5 Investigating Gas Laws】的解答,如需了解學校/賽事/課程動態,可至翰林教育官網獲取更多信息。
往期文章閱讀推薦:
MIT官方發布【2026年夏季推薦閱讀書單】!橫跨科學/人文/經濟...


翰林AMC8視頻課重磅上線!

國際競賽真題資源免費領取






