The decreasing activity of a source can be shown on a graph against time. The fluctuations show the randomness of radioactive decay

The rate at which the unstable nuclei from a source of radiation decays
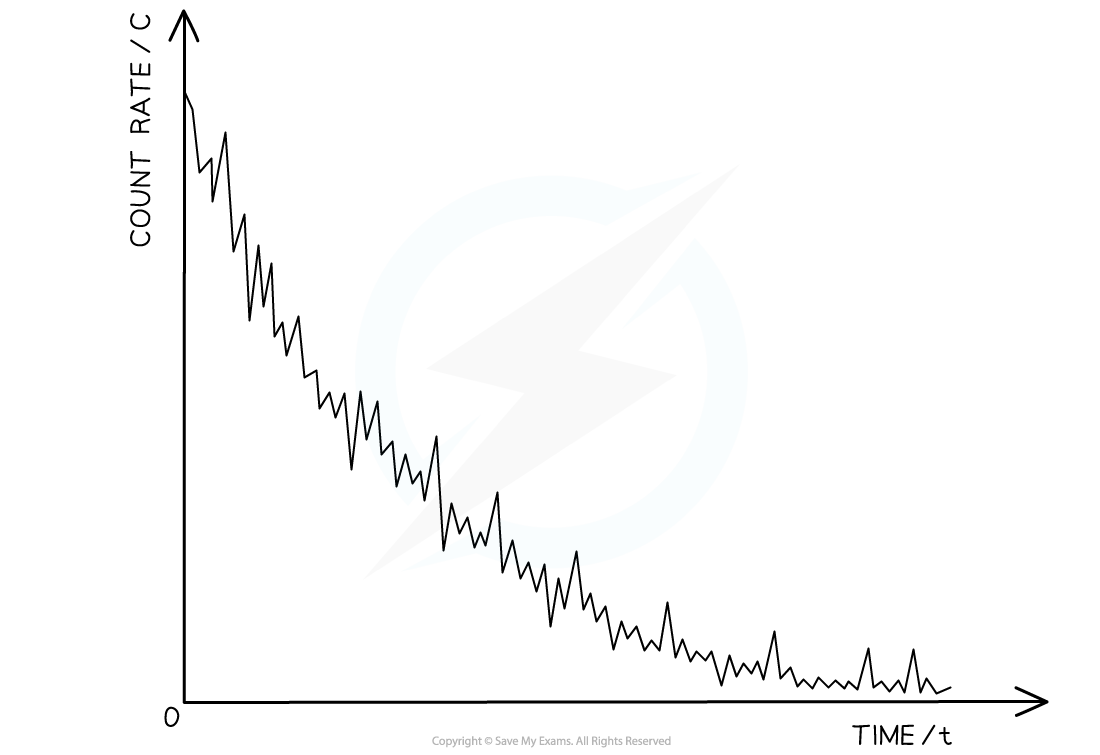
The decreasing activity of a source can be shown on a graph against time. The fluctuations show the randomness of radioactive decay
A source of radiation has an activity of 2000 Bq. How many unstable atoms decay in 2 minutes?
Step 1: Determine the activity
Step 2: Determine the time period in seconds
2 × 60 = 120 seconds
Step 3: Multiply the activity by the time period
Activity (Bq) × Time period (s) = 2000 × 120 = 240 000
Do not confuse?activity?and?count rate.Activity is the rate at which unstable nuclei decay, whereas count rate is the rate at which radioactive emissions are detected.
轉(zhuǎn)載自savemyexams
以上就是關(guān)于【Edexcel IGCSE Physics 復(fù)習(xí)筆記 7.2.1 Activity & Decay】的解答,如需了解學(xué)校/賽事/課程動態(tài),可至翰林教育官網(wǎng)獲取更多信息。
往期文章閱讀推薦:
斯坦福大學(xué)官方推薦書單!名校學(xué)霸們暑假都在讀什么?
MIT官方發(fā)布【2026年夏季推薦閱讀書單】!橫跨科學(xué)/人文/經(jīng)濟...









