IB DP Maths: AA HL復習筆記4.7.1 Probability Density Function

Calculating Probabilities using PDF
A?continuous?random?variable?can take?any?value in an interval so is typically used when continuous quantities are involved (time, distance, weight, etc)
What is a probability density function (p.d.f.)?
- For a continuous random variable, a function can be used to model probabilities
- This function is called a?probability?density?function?(p.d.f.), denoted by f(x)
- For f(x) to represent a p.d.f. the following conditions must apply
- f(x) ≥ 0 for?all?values of x
- The?area?under the graph of y = f(x) must?total?1
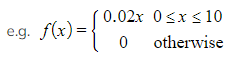
- In most problems, the?domain?of x is restricted to an interval, a ≤ X ≤ b say, with all values of x outside of the interval having f(x)=0
How do I find probabilities using a probability density function (p.d.f.)?
- The probability that the continuous random variable X lies in the interval a ≤ X ≤ b, where X has the probability density function f(x), is given by
-
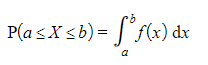 P(a ≤ X ≤ b) = P(a < X < b)
- For?any?continuous random variable (including the normal distribution) P(X = n) = 0
- One way to think of this is that a = b in the integral above
- For?linear?functions it can be easier to find the probability using the area of geometric shapes
- Rectangles: A = bh
- Triangles: A = ?(bh)
- Trapezoids: A = ?(a+b)h
How do I determine whether a function is a pdf?
- Some questions may ask for justification of the use of a given function for a probability density function
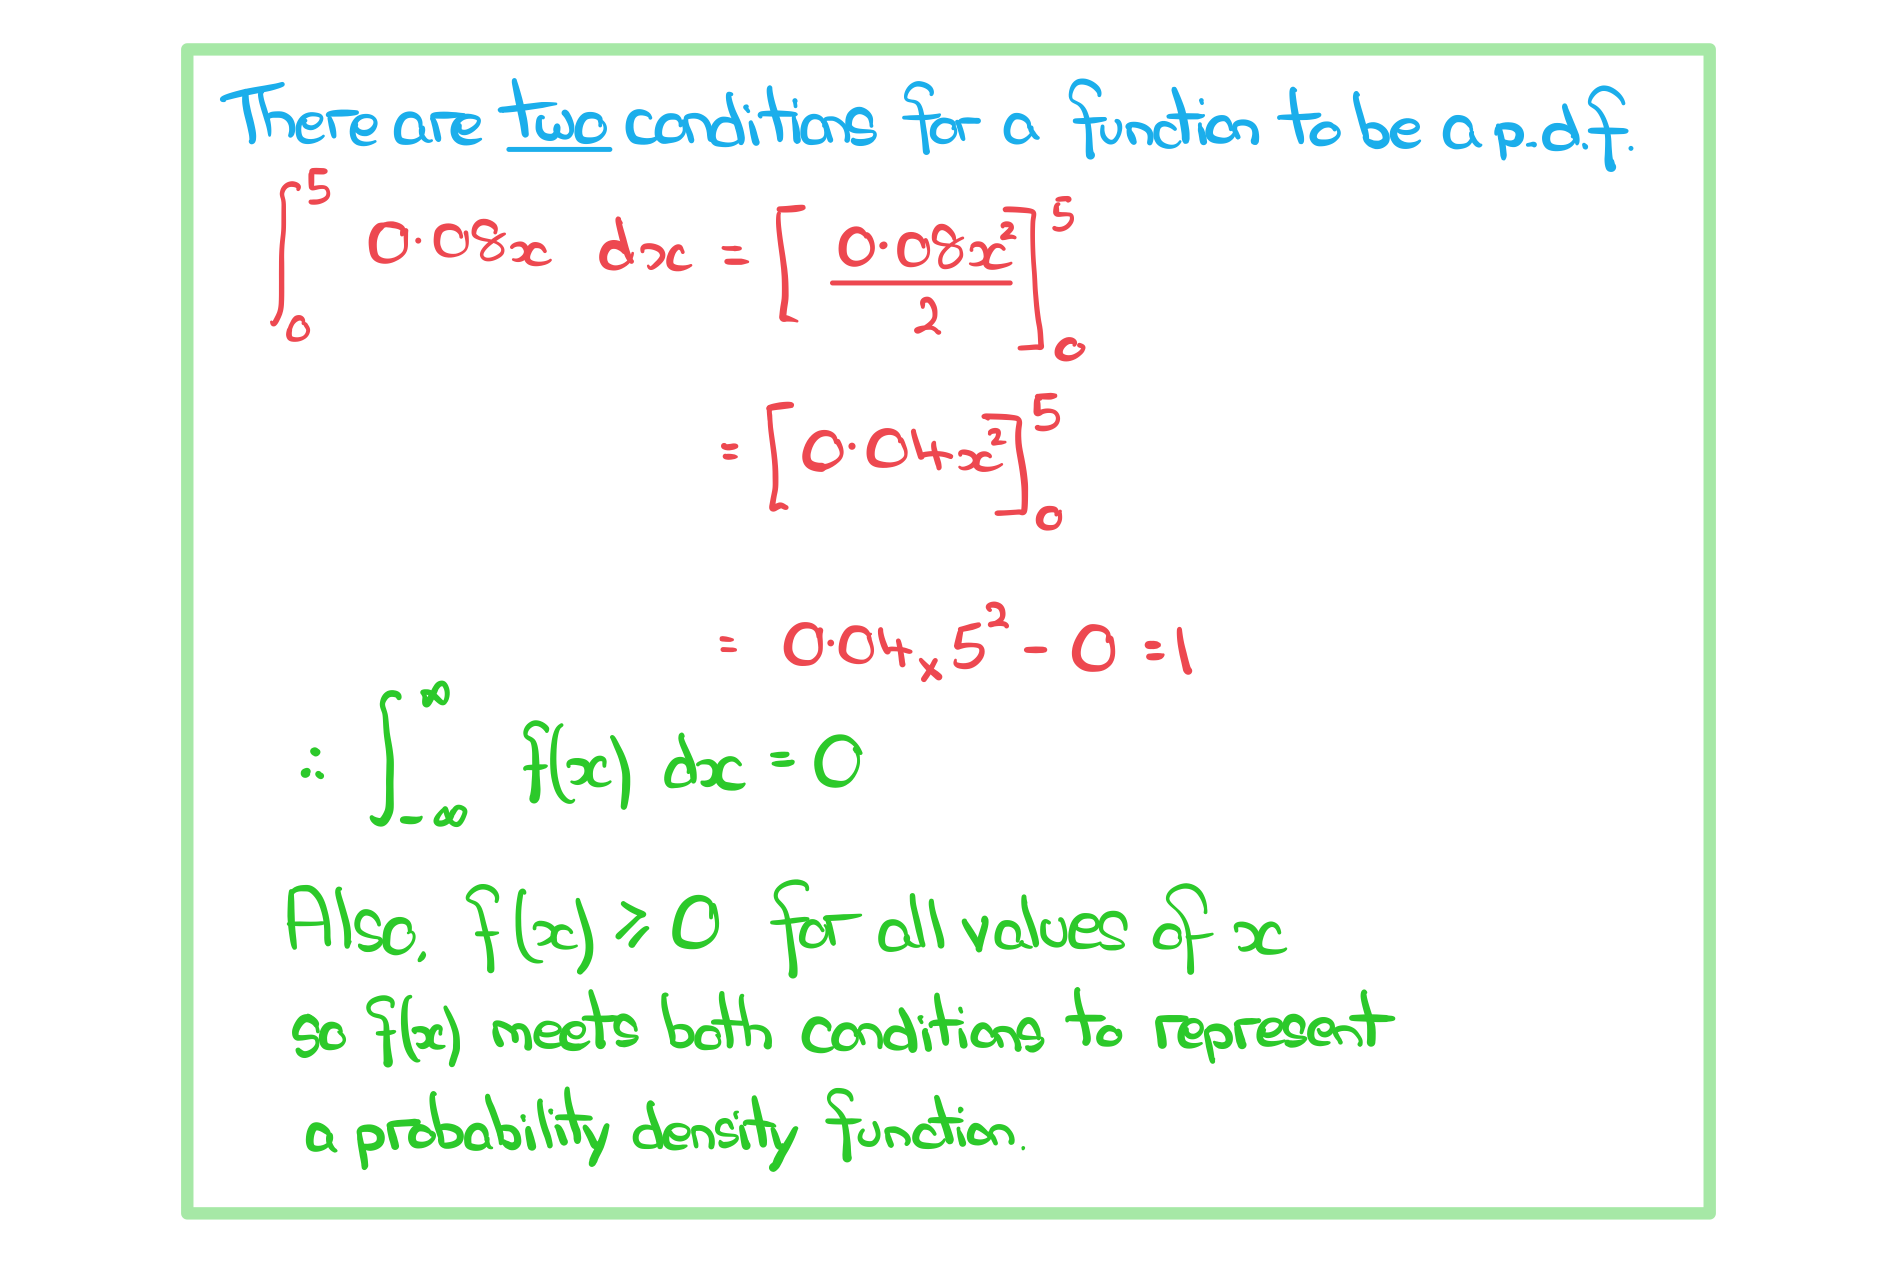
- In such cases check that the function meets the two conditions
- f(x) ≥ 0 for?all?values of x
- total area?under the graph is 1
- In such cases check that the function meets the two conditions
How do I use a pdf to find probabilities?
STEP 1
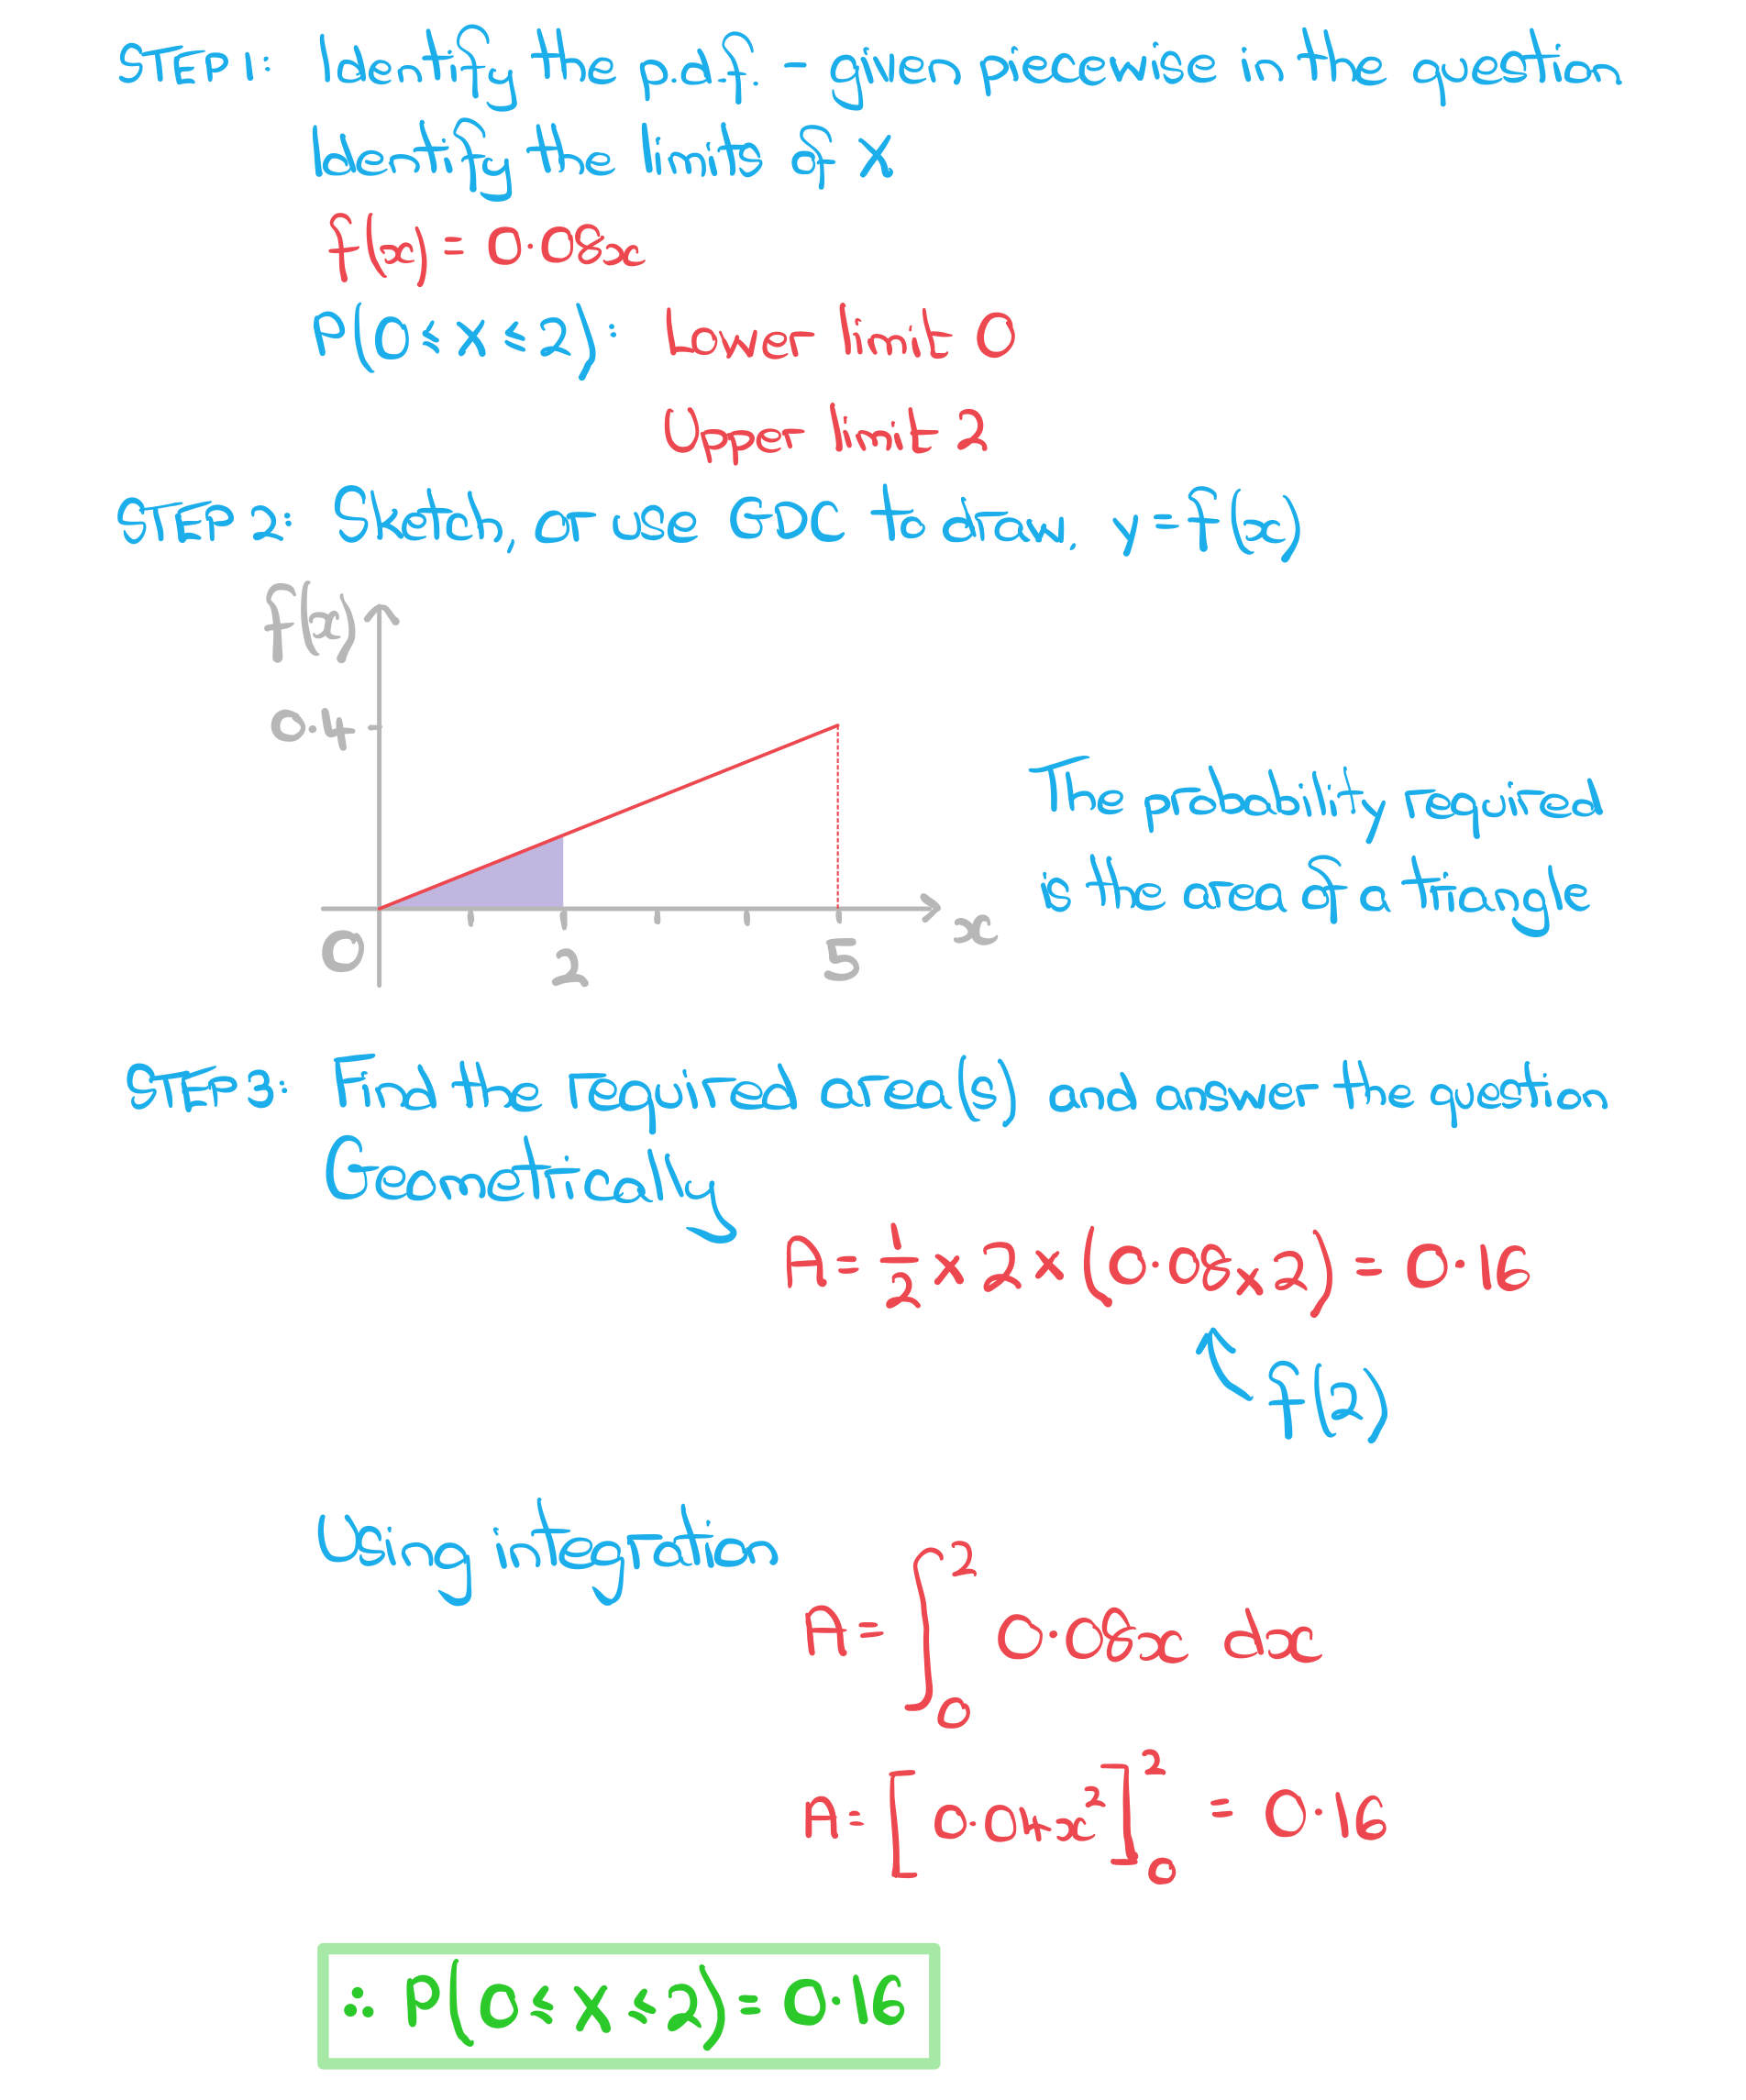
Identify the?probability density function,?f(x) - this may be given as a?graph,?an?equation?or as a?piecewise function
 Identify the?limits?of X for a particular problem
Remember that P(a ≤ X ≤ b) = P(a < X < b)
STEP 2
Sketch, or use your GDC to draw, the graph of y = f(x)
Look for basic shapes (rectangles, triangles and trapezoids) as finding these areas is easier without using integration
Look for symmetry in the graph that may make the problem easier
Break the area required into two or more parts if it makes the problem easier
Look for basic shapes (rectangles, triangles and trapezoids) as finding these areas is easier without using integration
Look for symmetry in the graph that may make the problem easier
Break the area required into two or more parts if it makes the problem easier
STEP 3
Find the area(s) required using basic shapes or integration and answer the question
- Trickier problems may involve finding a limit of the integral given its value
- i.e. Find one of the boundaries in the domain of X, given the probability
- e.g. Find the value of a given that P(0 ≤ X ≤ a) = 0.09
- i.e. Find one of the boundaries in the domain of X, given the probability
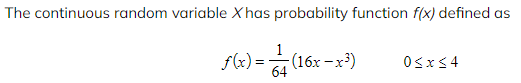
Worked Example
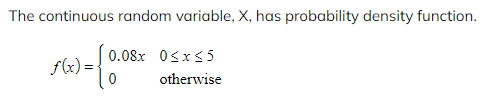 a)? ? ? ?Show that f(x) can represent a probability density function.
b)? ? ? ?Find, both geometrically and using integration, P(0 ≤ X ≤ 2).
c)? ? ? ?Write down P(X = 3.2).

Median & Mode of a CRV
What is meant by the median of a continuous random variable?
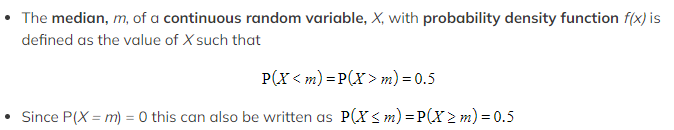 IF?the p.d.f. is?symmetrical?(i.e. the graph of?y = f(x)?is symmetrical) then the?median?will be?halfway?between the?lower?and?upper?limits of?x
- In such cases the graph of?y = f(x)?has?axis?of?symmetry?in the line x = m
How do I find the median of a continuous random variable?
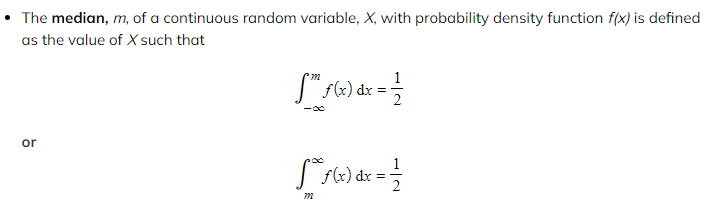 The?equation?that should be used will depend on the?information?in the?question
- If the?graph?of?y = f(x)?is?symmetrical,?symmetry may be used to?deduce?the?median
- This may often be the case if?f(x)?is?linear?and the?area under the graph?is a basic?shape?such as a?rectangle
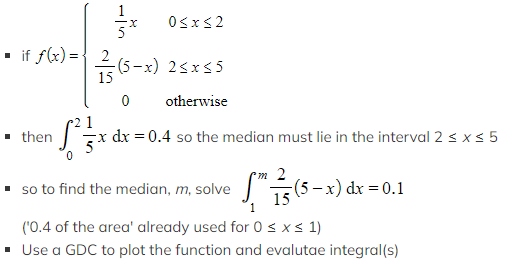
How do I find the median of a continuous random variable with a piecewise p.d.f.?
- For?piecewise functions,?the?location?of the?median?will determine?which equation?to use in order to find it
- For example
 What is meant by the mode of a continuous random variable?
- The?mode?of a?continuous random variable,?X, with?probability density function?f(x)?is the?value?of?x?that produces the?greatest value?of?f(x)
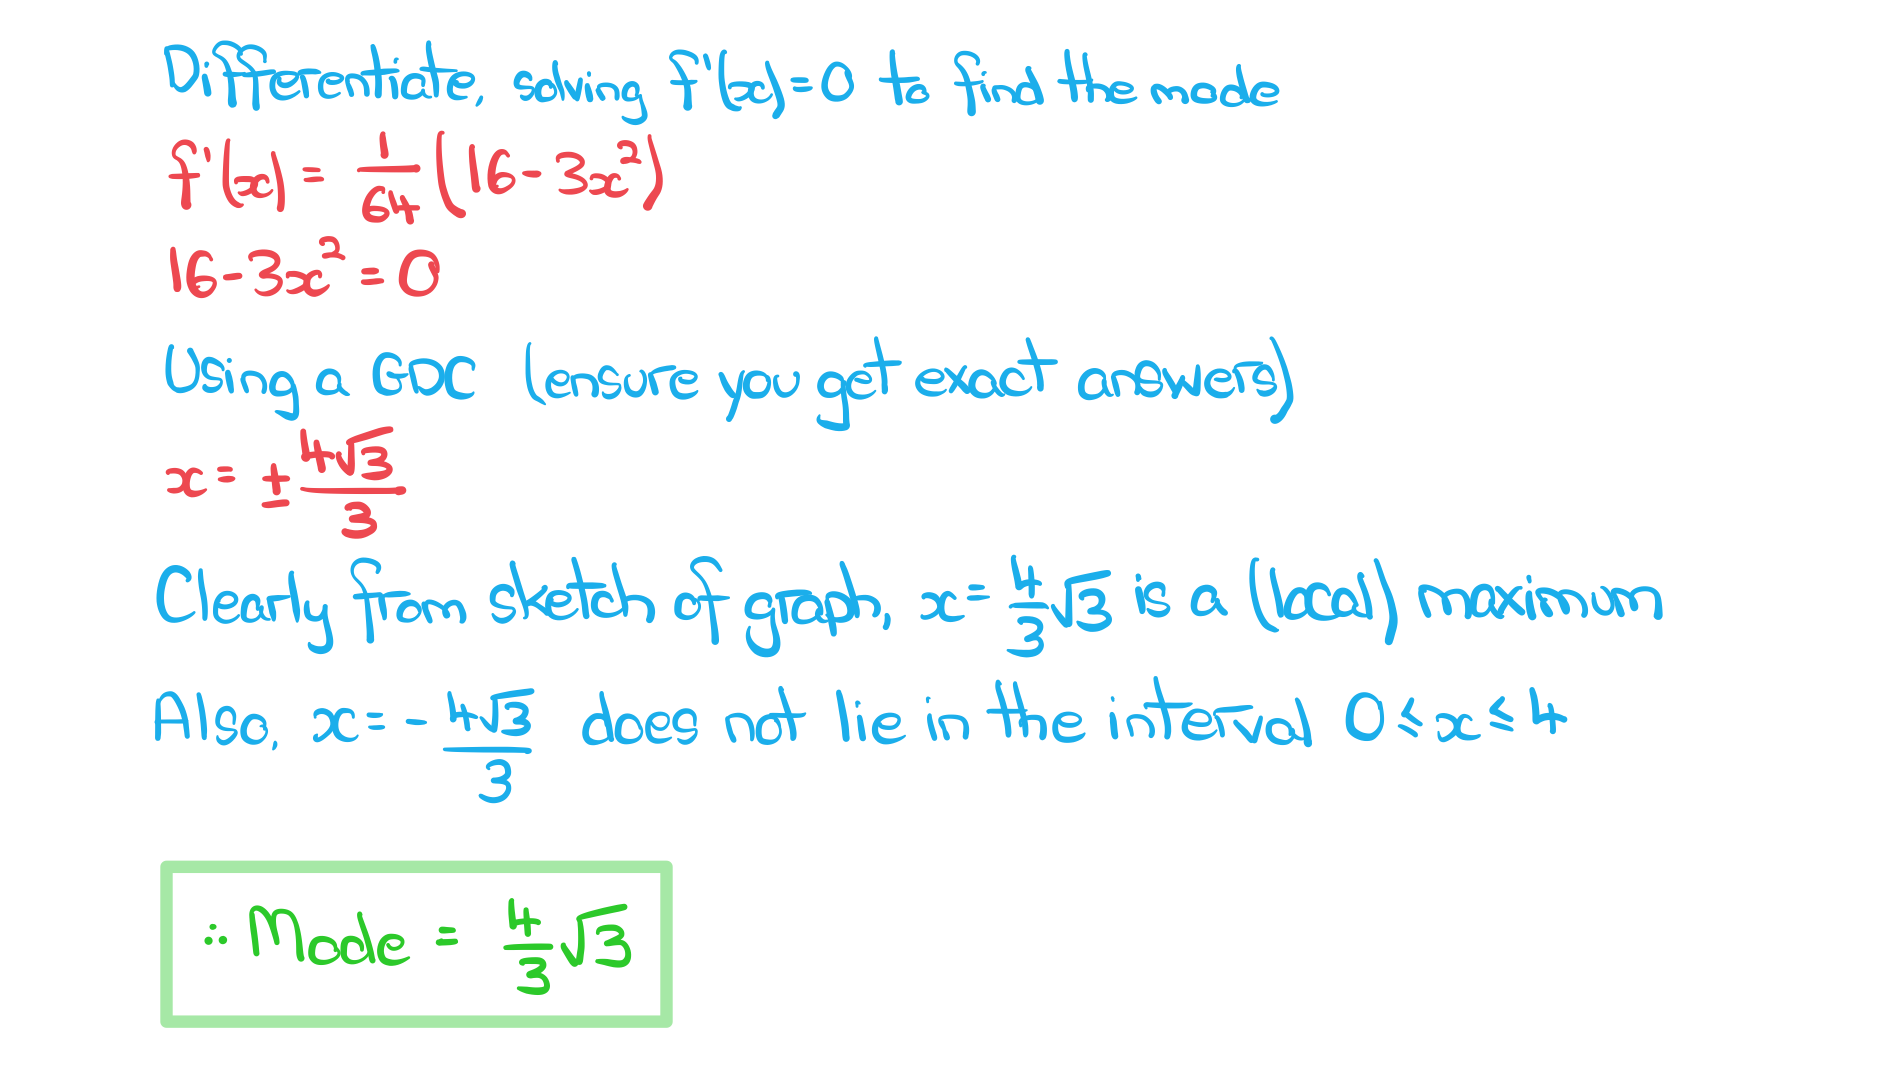
How do I find the mode of a continuous random variable?
- This will depend on the?type?of?function?f(x); the easiest way to find the?mode?is by considering the?shape?of the?graph?of?y = f(x)
- If the?graph?is a?curve?with a?maximum point,?the?mode?can be?found?by?differentiating?and?solving?f’(x) = 0
- If there is?more than one solution?to?f’(x) = 0?then?further work?may be needed in deducing the mode
- There could be?more than one?mode
- Look for?valid values?of?x?from the?domain?of the p.d.f.
- Use the?second derivative?(f’’(x)) to?deduce?the?nature?of each?stationary point
- Check?the?values?of?f(x)?at the?lower?and?upper limits?of?x, one of these could be the?maximum value?f(x)?reaches
- If there is?more than one solution?to?f’(x) = 0?then?further work?may be needed in deducing the mode
- If the graph of?y = f(x)?is?symmetrical,?symmetry may be used to deduce the mode
- For a?symmetrical?p.d.f.,?median = mode = mean
Worked Example
 a)? ? ? Find the median of X, giving your answer to three significant figures.
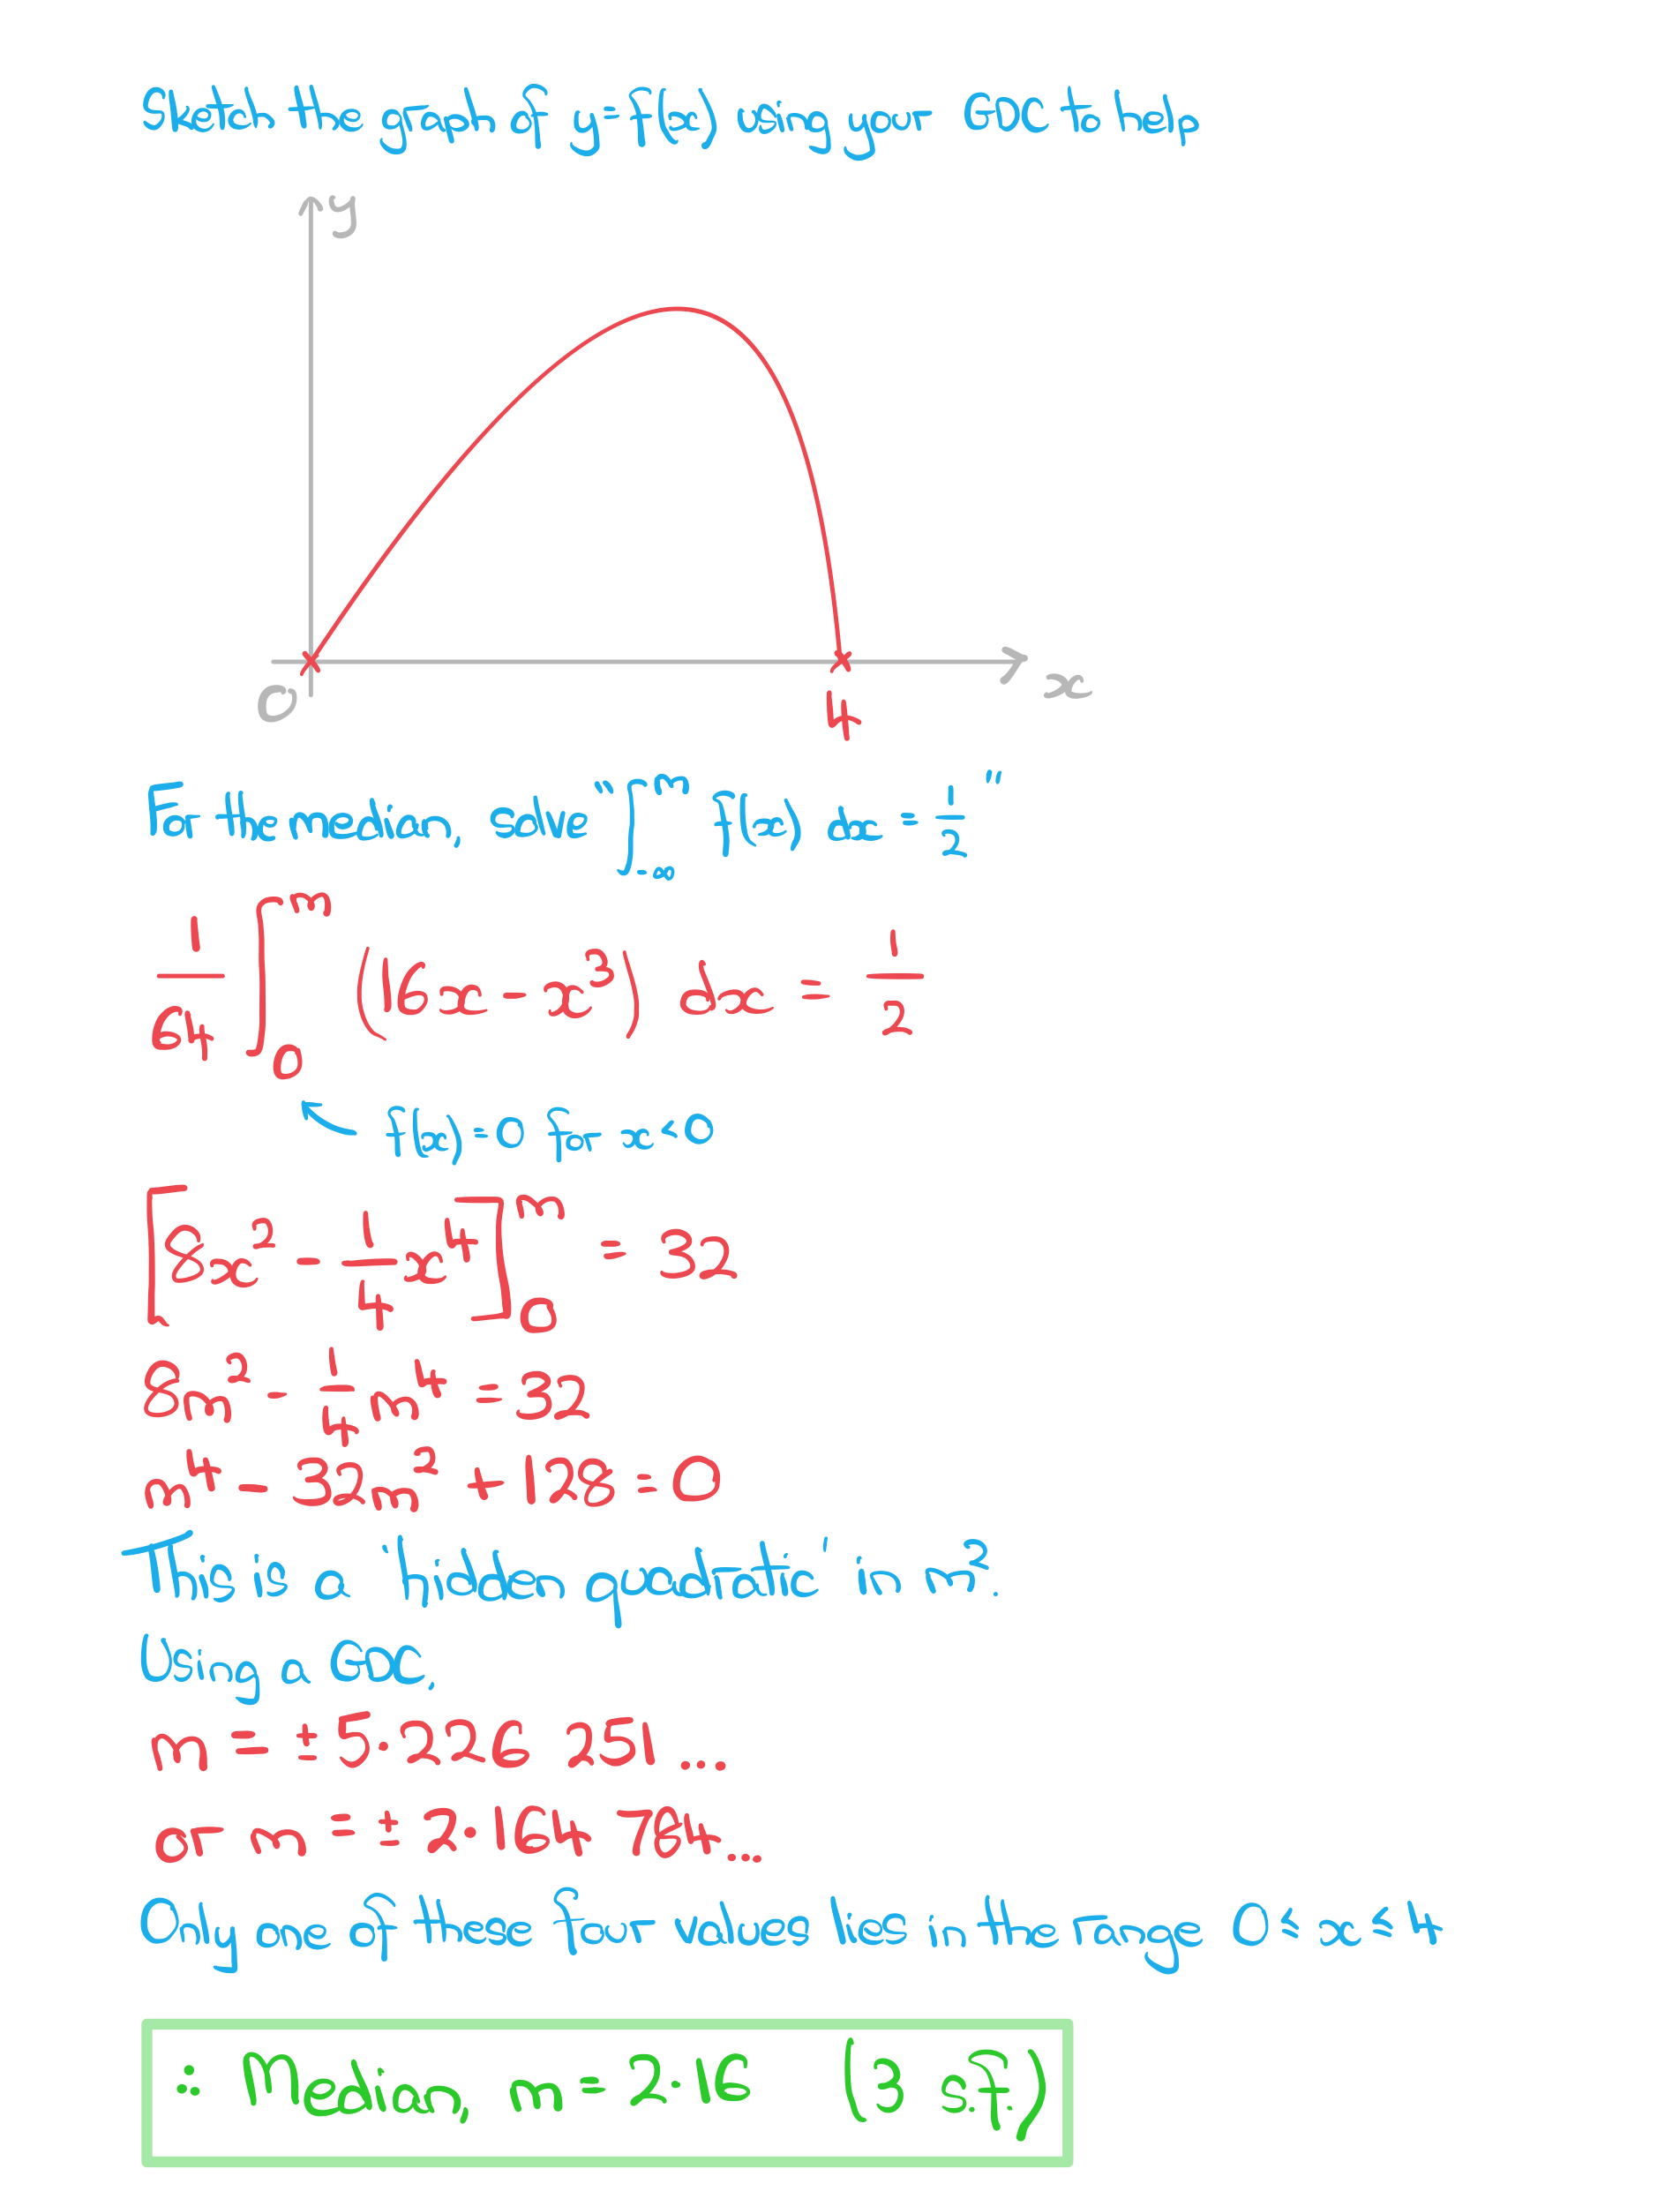
b)? ? ? Find the?exact?value of the mode of X.
Mean & Variance of a CRV
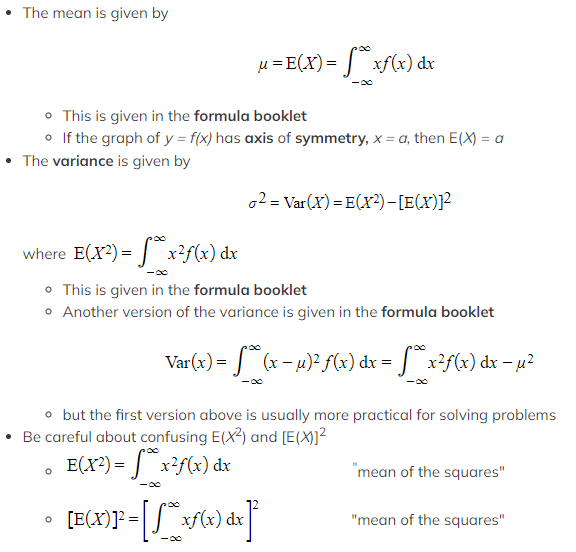
What are the mean and variance of a continuous random variable?
- E(X) is the?expected value,?or?mean,?of the?continuous random variable?X
- E(X) can also be denoted by?μ
- Var(X) is the?variance?of the continuous random variable?X
- Var(X) can also be denoted by σ2
- The?standard deviation,?σ, is the?square root?of the?variance
How do I find the mean and variance of a continuous random variable?
 How do I find the mean and variance of a linear transformation of a continuous random variable?
- For the?continuous random variable,?X, with?mean?E(X) and?variance?Var(X) then
 Exam Tip
- Using your?GDC?to draw the graph of?y = f(x)?can?highlight?any?symmetrical?properties which?reduce?the?work?involved in finding the?mean?and?variance
Worked Example
 a)? ? ? Find the mean of?X.
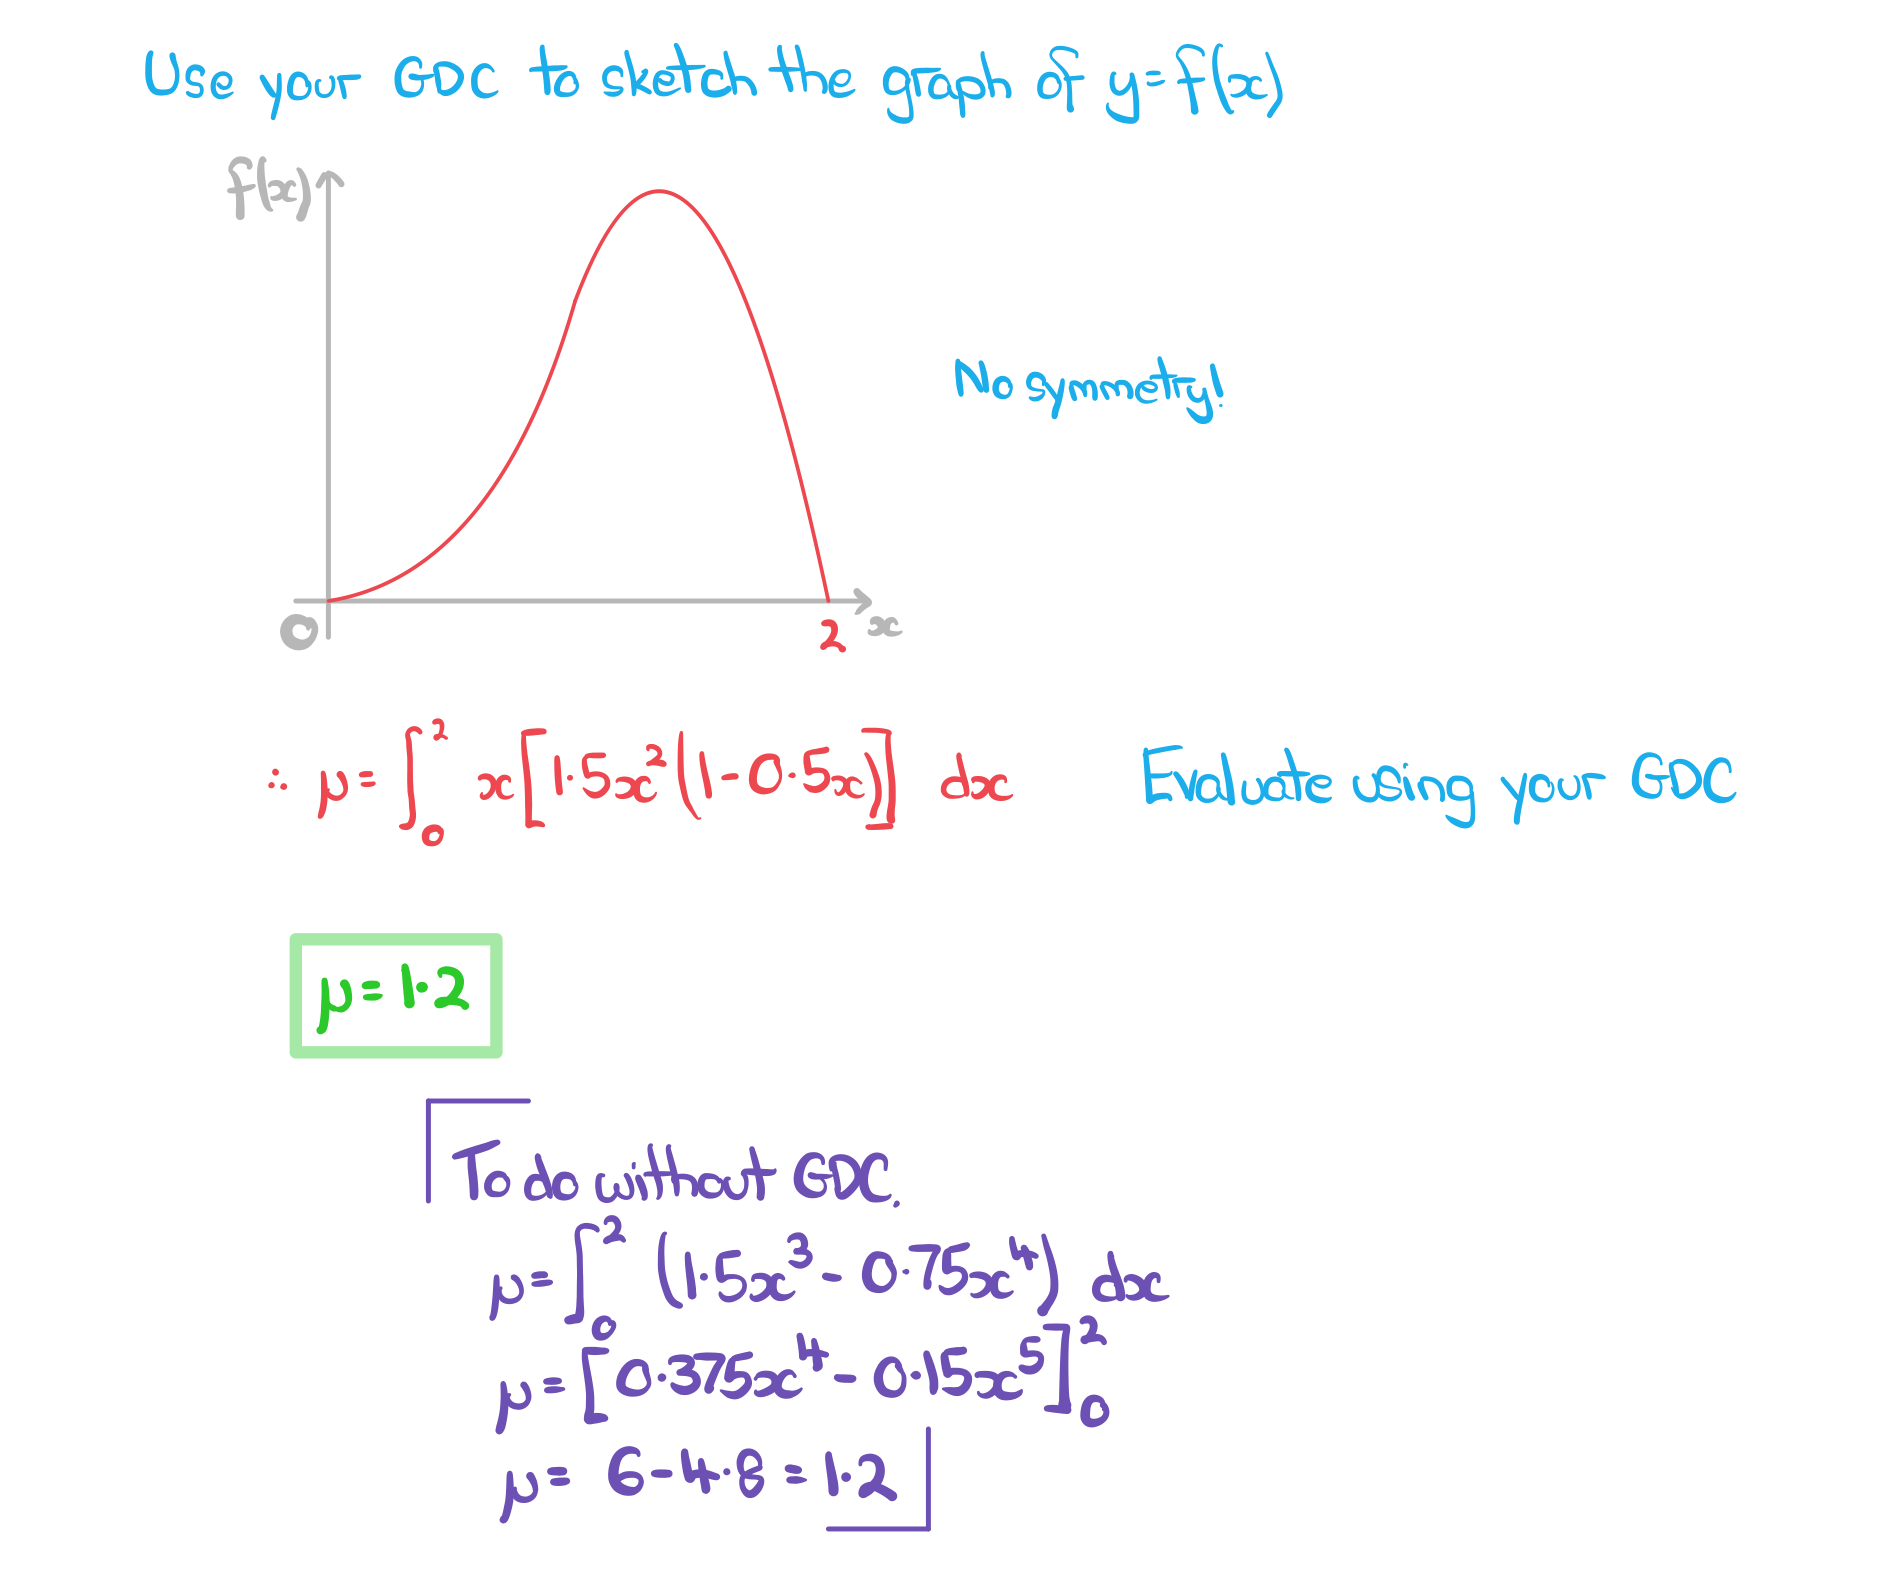
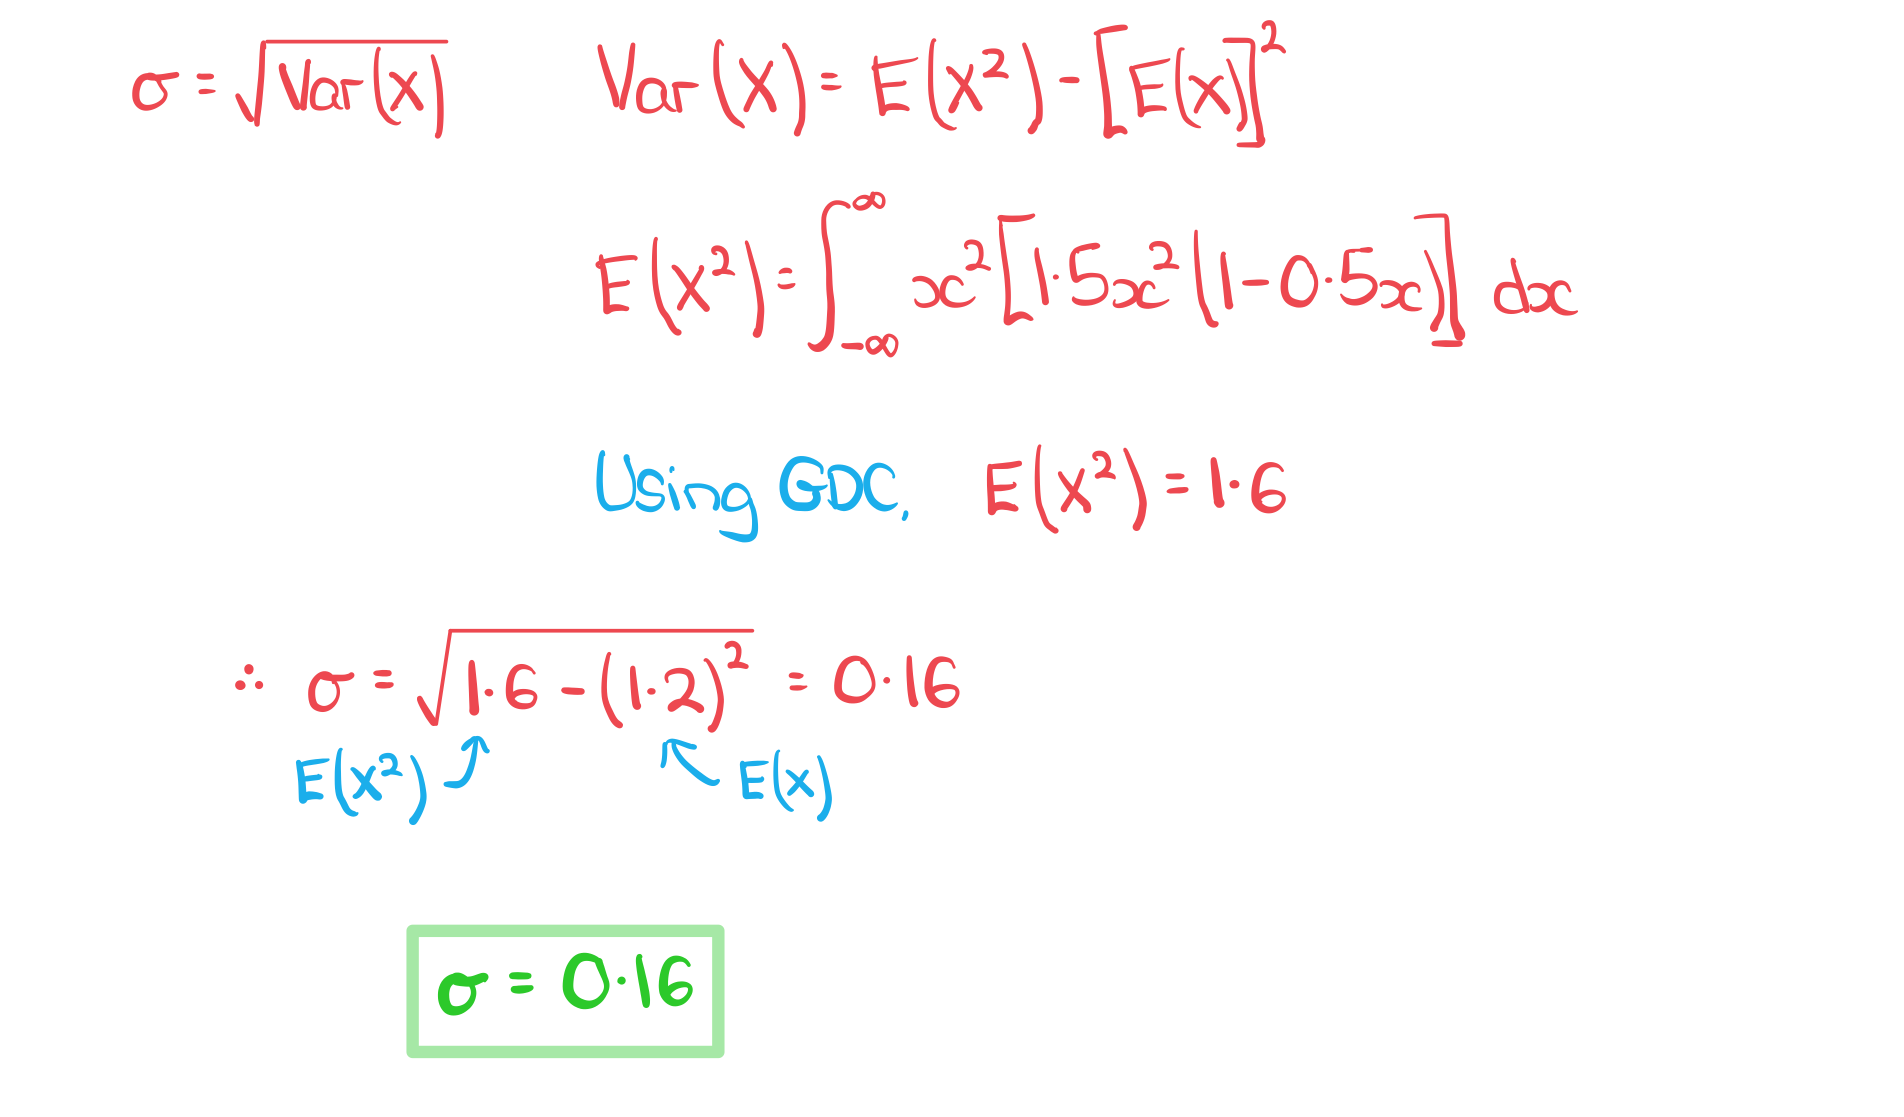
b)? ? ? ?Find standard deviation of?X.
轉載自savemyexams

國際競賽真題資源免費領取


美高學分項目重磅來襲!立即了解