Edexcel IGCSE Maths 復習筆記 6.1.3 Averages from Grouped Data

Edexcel IGCSE Maths 復習筆記 6.1.3 Averages from Grouped Data
What is grouped data and why use it?
- Some data for a particular scenario can vary a lot
- For example, the heights of people, particularly if you include a mixture of children and adults
- Because data like height is also?continuous?(essentially data that can be measured) it would be difficult, even using a table, to list every height that gets recorded – also, there is little difference between someone who is 176 cm tall and someone who is 177cm tall
- So we often group data into?classes?but that leads to one important point.…
What do I need to know?
- When data is grouped we lose the?raw data
- With height data this means we might know, how many people have a height of between 150 cm and 160 cm but not the specific heights of those 10 people
- This means we cannot find the actual?mean,?median?and?mode?from their original definitions – but we can?estimate the mean?and we can also talk about the?class the median lies in?and the?modal class
- Estimating the Mean
- There is one extra stage to this method compared to finding the mean from tables with discrete data – use the class?midpoints?as our data valueseg. the heights of 25 members of a youth club were recorded and the results are summarised in the table below – estimate the mean height
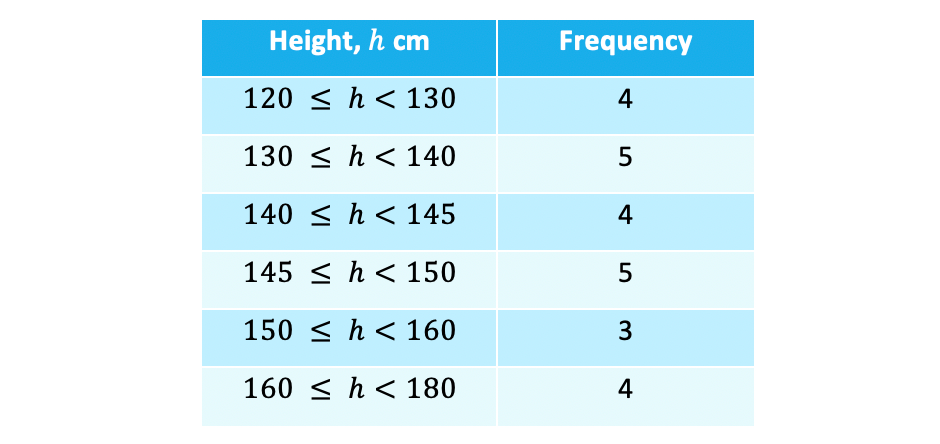
- Note that the?class widths?(group sizes) are not all equal (this is not a problem so do not let it put you off) and be careful with the inequality signs: a height of exactly 130 cm would be recorded in the second row not the first
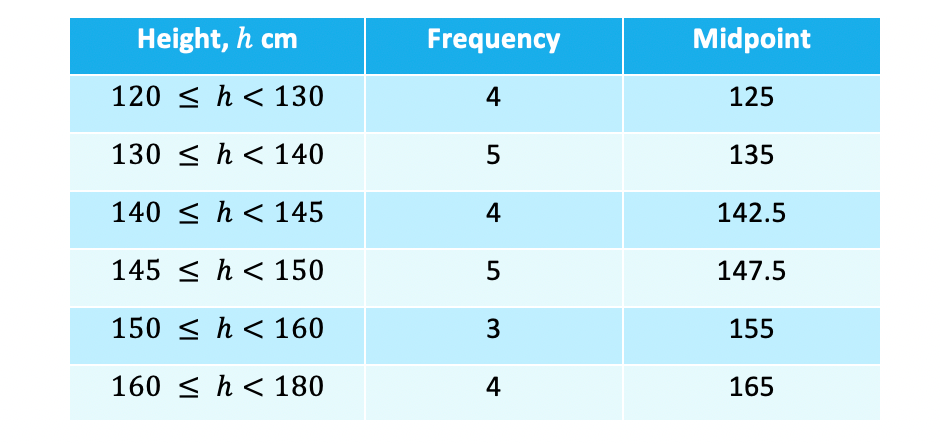
- As we don’t know the original data we use the midpoint of each group – this is the height that is half way between the start and the end of the group
- Usually these are easy to ‘see’ but you can always work it out if in doubt (eg halfway between 140 and 145 is (140 + 145) ÷ 2 = 285 ÷ 2 = 142.5)
- We then use theses midpoints as the heights for all the people in the 120 ≤ h < 130 class – so we assume that all 4 people in the class will have a height of 125 cm
- This is why the mean will be an estimate – we assume the heights in all the classes ‘a(chǎn)verage out’ at the midpoint height
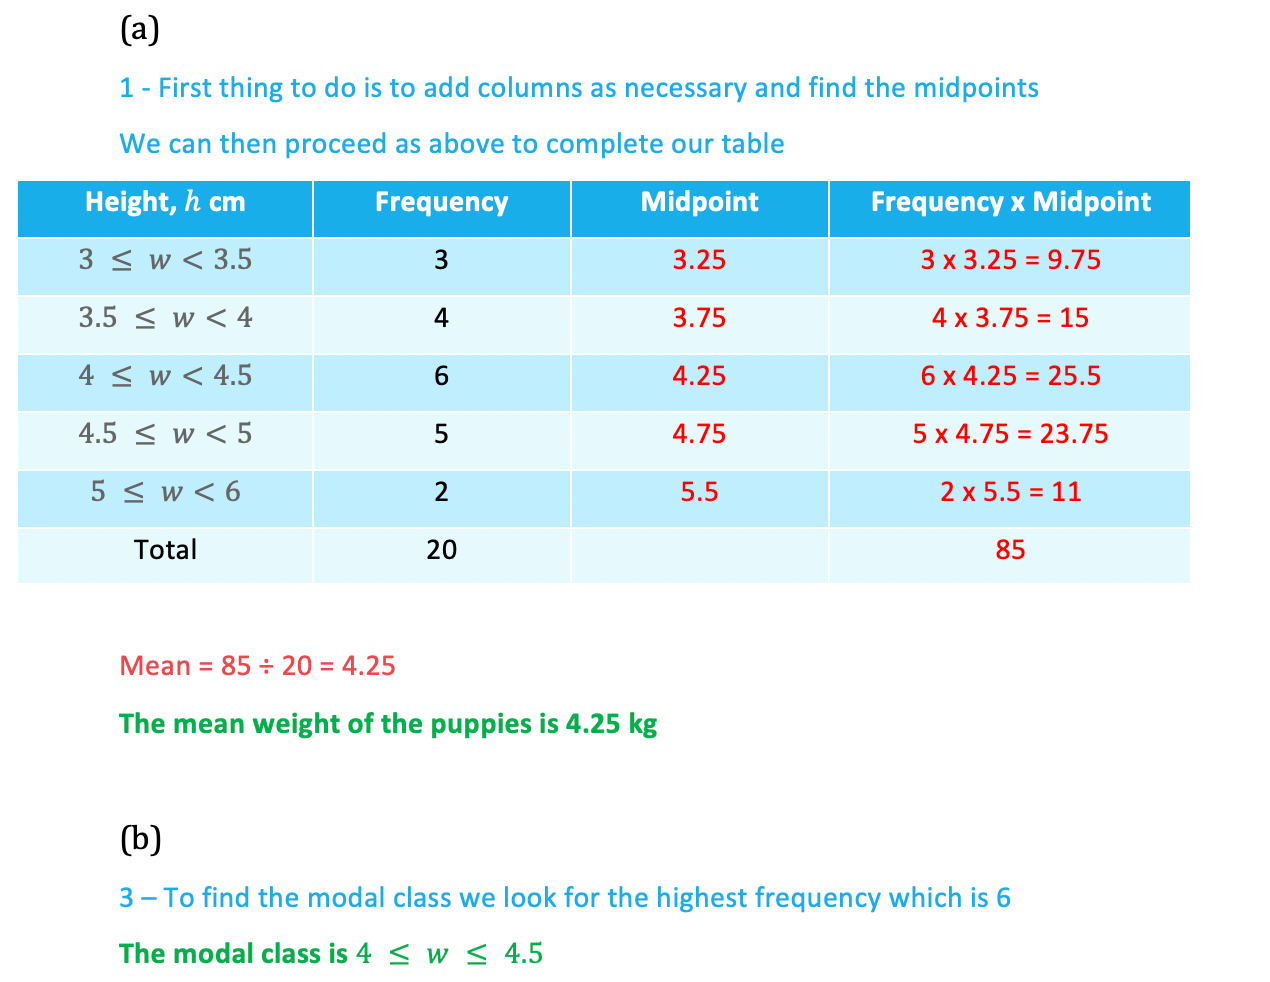
- Now we can proceed as if it were discrete data and multiply, including a total row as well
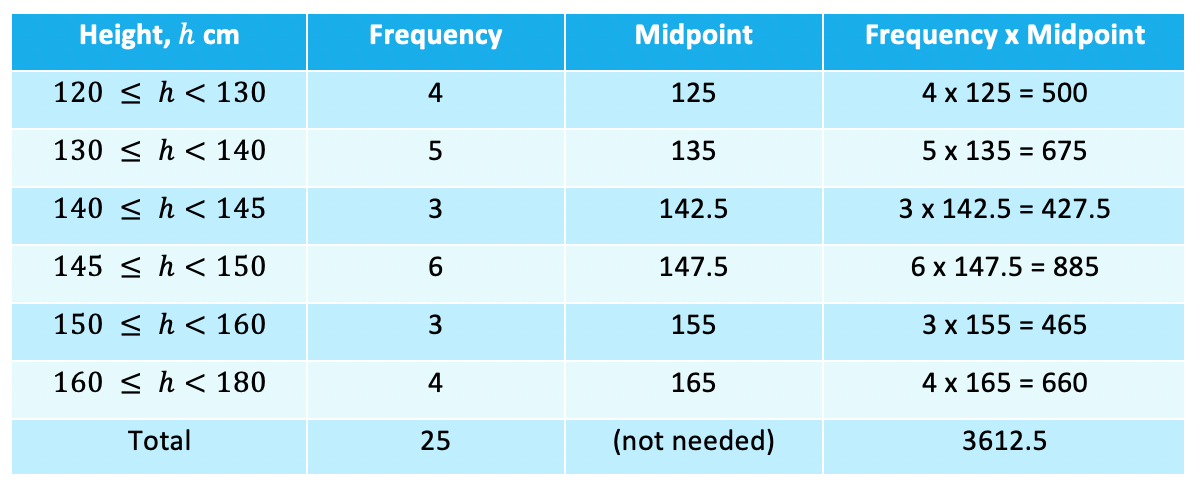
- And finally we can find the mean:Mean = 3612.5 ÷ 25 = 144.5Mean height is 144.5 cm
2. Median
- Rather than find an actual value for the medium you could be asked to find the class in which the median lies
- The process for finding its position is the same as before so for the above example:
Position of median = (25 + 1) ÷ 2 = 13
The median is the 13th?value
- From looking at the frequency column we can see the 13th?value would fall in the 145 ≤ h < 150 class (it is the last value in this class in fact)So we would say the?median lies in the 145 ≤ h < 150?class
3. Modal Class?(Mode)
- Similar to finding the median we are only interested in the class the modal value lies within.
- Again using the example above we can see from the table the highest frequency is 6
- So the?modal class is?145 ≤ h <150
Exam Tip
When presented with data in a table it may not be obvious whether you should use the technique below or the one from the previous notes (see Averages from Tables & Charts) but when you see the phrase “estimate?the mean” you know that you are in the world of grouped (and usually continuous) data so you know to use the method below.
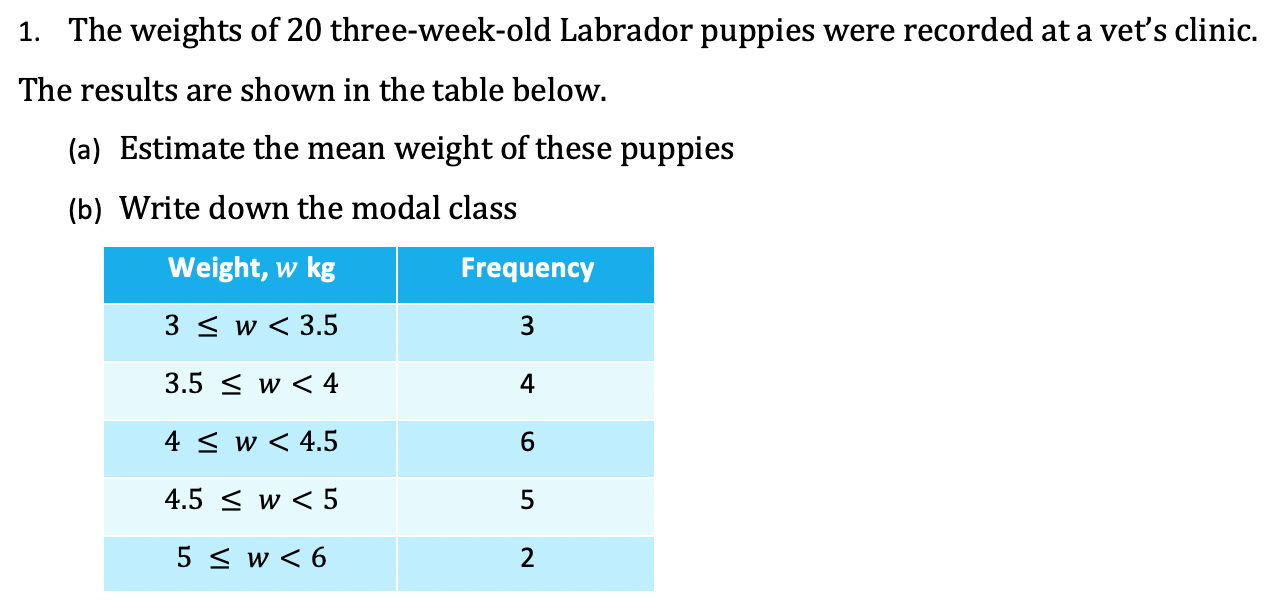
Worked Example
轉載自savemyexam

國際競賽真題資源免費領取


美高學分項目重磅來襲!立即了解