雅思表格題如何處理?task 1表格專項分析

不少烤鴨遇到表格題都會聞風喪膽,具體癥狀如下:
不會系統處理數據,經常遺漏重要信息
數據雜亂無章,一時半會找不出明顯特征,無從下手
特征找到了,但不知道用什么樣的順序或銜接方式把這些特征清晰的呈現
相反,表格題反而是最簡單,最不容易出錯的一類題目。
下面的內容我們還是分成語言積累、思路分析和范文講解這三部分來學習表格的寫法!
語言積累
對于語言基礎并不扎實的小白鴨同學來說,掌握數據不同走向、倍數、分數等表達是寫好表格的重中之重,因為在評分標準中lexical resource要求我們的用詞和句法要有多樣性,因此很多同學會從天南海北搜羅“史上最全/最強/最高級折線圖表達”,then, 早鳥同學會緊鑼密鼓的開始背誦,懶癌晚期的同學會任它們在收藏夾中自生自滅。
但實際上,腦子輸入越多,在正式寫文章的時候越容易混亂,會糾結到底選擇哪個表達最合適呢,嚴重些還可能會用錯。因此,在積累句式表達的時候,一定要遵循一個原則:less is more每一類的表達積累2-3個即可。
描述數據上升/下降趨勢
同折線圖表達
描述倍數
過去十年,核能所占的比例已經由之前的5%增長到現在的10%。
Over the past decade, the percentage of riceincreased by 20% to 40%.
用double
Over the past decade, rice doubled its percentage from 20% to 40%.
農業用水由1900年的500km3 增長至現在2000km3.
Water used in agriculture is 4 times as much as that in 1900(500km3).
Water usage in agriculture is 4 times more than that in 1900 (500km3).
Agriculture quadrupledits usage from 500km3 in 1900 to 2000km3 at present.
Agriculture use has increased fourfold over the past century.
描述分數?
他們中約有三分之一抵達美國的人是難民。
About one-third of them arrived in the U.S. are refugees. (謂語動詞的單復數取決于名詞)
近一半的非裔美國成年人有某種心臟或血管疾病,包括高血壓。
Nearly a half African American adults have some sort of heart or vasculardisease, including hypertension.
約四分之三的新增病例出現在中國以外地區。
About three-fourths of all new infections are being reported in countries other than China.
在表格題的寫作中,對數據進行描述如果全部使用題目中給出的數字或者百分比會略顯單調,如果在做數據的對比時出現了倍數或者分數關系,可以嘗試進行替換,體現出詞匯、句式表的靈活性。
出國留學考試,雅思托福等必備資料,考試真題,掃碼免費領取!
更有名師指導,講座答疑!

分析圖表
掌握好常用的句式詞匯表達后,我們要進階到圖表分析階段啦。
表格題的數據看似雜亂無章,讓人無從下手,實際上,我們只要找好數據分類的標準,就可以化繁為簡。
分類標準:1. 按縱軸分類 2. 按橫軸分類
具體按照哪一軸要根據圖表中給出的數據來判斷,如果橫軸中的數據對比關系明顯,并包含一些特殊數據(如最大值,最小值,等值,倍數關系等),我們就可以按照橫軸進行描述,縱軸同理。
來看下面這道題
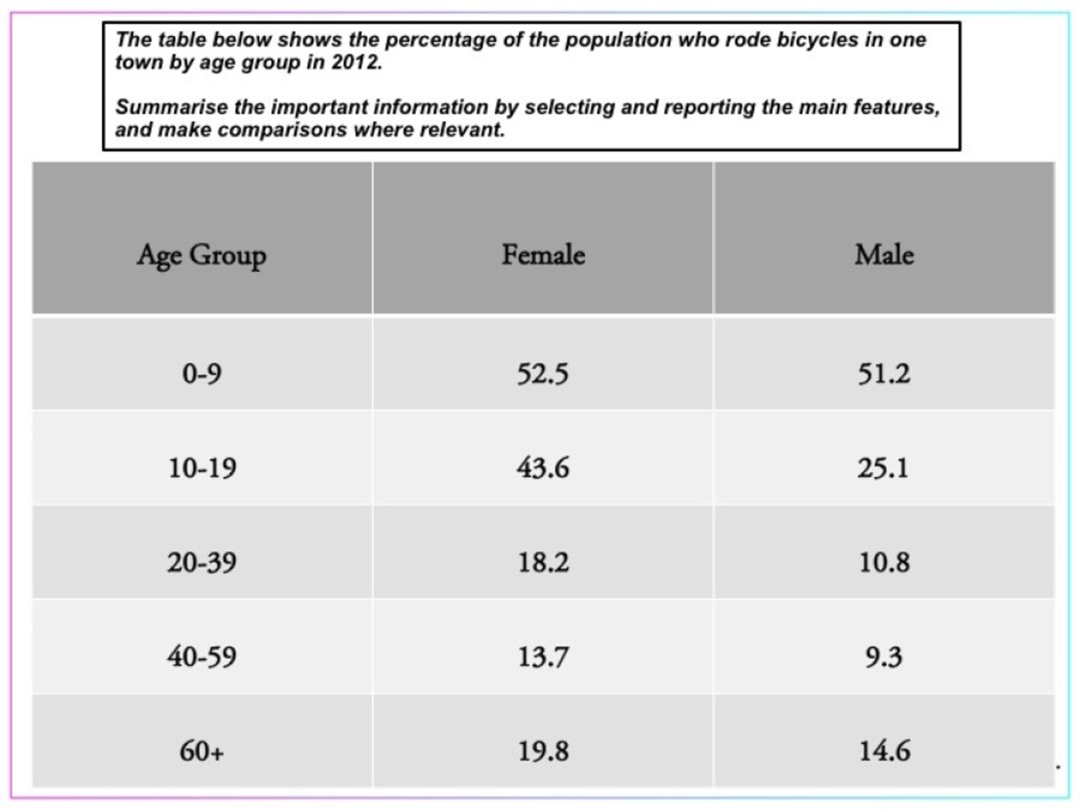 對于初學乍練的同學來說,拿到題目之后,可以先對于一些特殊值在表格中做一些標畫,幫助我們理清思路,如下圖。
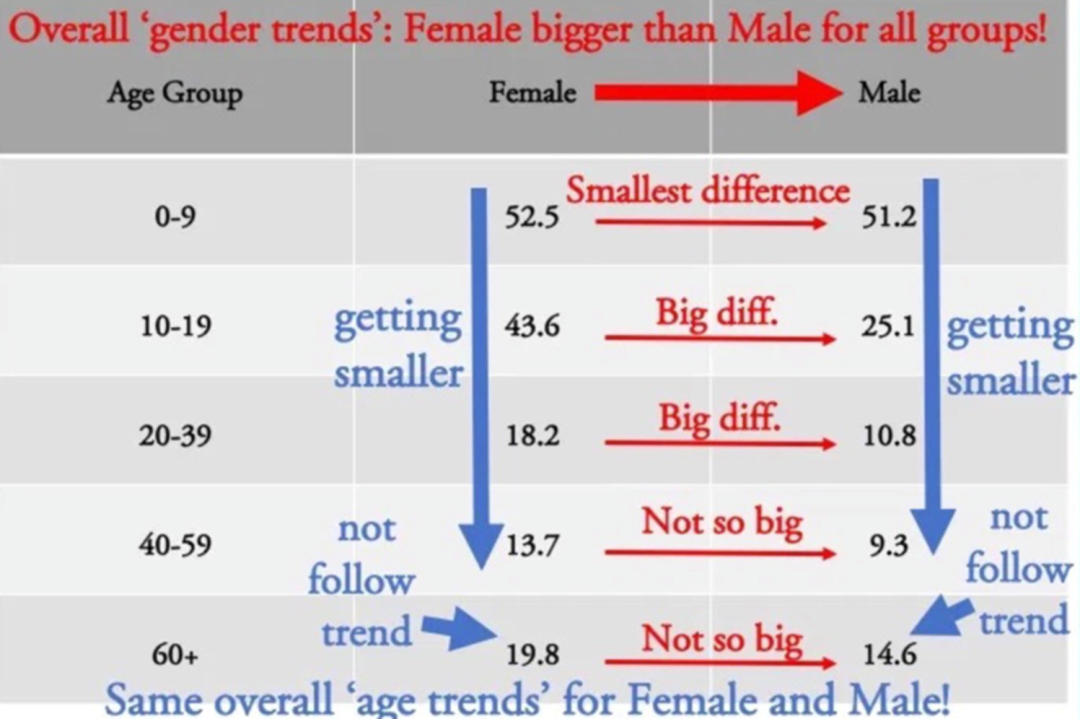 這樣分析可得知,如果從橫軸的female和male進行分析,可以比較的數據并不是很有特色,不能體現出我們的分析能力。而縱軸按agegroup進行分析,可以發現我們能呈現在文章中的信息會更多樣化,比如極值/變大變小趨勢/相同趨勢等。因此,一通分析之后,我們決定按縱軸組織文章~
范文參考
思路分析之后,讓我們一起看下范文是如何將這些數據組織成有邏輯的文章吧!
The table illustrates the proportions ofpeople across different age categories who rode bicycles in one particular townin 2012.
introduction:對題干進行改寫 percentage->proportion; age group->different age categories
Overall, the table clearly shows that ahigher proportion of females cycled in the given period compared to malesacross all ages. This group (0-9 yrs.) had the largest proportion of cyclists,and age was a clear predictor for decreased cycling activity for both males andfemales, with the exception of the oldest age group (60+), which bucked thistrend.
overview:
1、在所有年齡段中,女性騎自行車的比例高于男;
2、0-9歲群體的騎車者比例最大;
3、年齡是男性和女性騎車活動減少的明顯因素,最年長的年齡組(60歲以上)除外,它與這一趨勢相反。
Turning to the figures, just over half ofall young girls and boys aged 0-9 years rode bikes in the town, with 52.5% and51.2% respectively, amounting to the smallest gender gap of any age group. Incontrast, 43.6% of 10-19 year old girls chose to ride bikes, while only 25.1%of boys did the same. This pattern continued with the 20-39 age group, with18.2% of young women cycling compared to 10.8% of young men.
body paragraph 1(直接按年齡順序進行描述):
1、0-9歲的女孩和男孩有一半以上騎自行車,并給出數據。并且是所有年齡組中最小的性別差距,體現出對比邏輯;
2、10-19歲和20-39歲的年齡組數據模式相似,騎自行車的女孩比男孩多。
The gender differences were lesssignificant in middle aged cyclists (40-59), with 13.7% (female) and 9.3%(male). Finally, the over 60s reversed this trend with more cyclists than theprevious two age groups, with 19.8% and 14.6% respectively for females andmales.
body paragraph 2:
1、中年騎車者(40-59歲)的性別差異不太明顯,給出數據。
2、60歲以上的人扭轉了這一趨勢,騎自行車的人多于前兩個年齡組,并給出數據。
以上就是關于【雅思表格題如何處理?task 1表格專項分析】的解答,如需了解學校/賽事/課程動態,可至翰林教育官網獲取更多信息。
往期文章閱讀推薦:
??2027年QS最佳留學城市排名發布!倫敦位列第三,北美竟無緣Top10 ?


翰林AMC8視頻課重磅上線!

國際競賽真題資源免費領取






