2011 AP Statistics統(tǒng)計學(xué)真題系列(Form B)之簡答題免費(fèi)下載

歷年AP?Statistics統(tǒng)計學(xué)系列
真題與答案下載

翰林國際教育全網(wǎng)首發(fā)
力爭超快速發(fā)布最全資料
助你在升學(xué)路上一帆風(fēng)順
為你的未來保駕護(hù)航
2011 AP Statistics (Form B) Free-Response Questions Free Download
2011 AP統(tǒng)計學(xué)(Form B)簡答題部分免費(fèi)下載
此套題共計1小時30分鐘,共6題
占總分50%
每道大題可能含有不同數(shù)量的小題
其中Part A建議用時1小時05分鐘,共5題,占Section II總分75%
Part B建議用時25分鐘,共1題,占Section II總分25%
可以使用圖形計算器
考試時會提供常用公式表
完整版下載鏈接見文末
部分真題預(yù)覽:
Part A:
1)Records are kept by each state in the United States on the number of pupils enrolled in public schools and the number of teachers employed by public schools for each school year. From these records, the ratio of the number of pupils to the number of teachers (P-T ratio) can be calculated for each state. The histograms below show the P-T ratio for every state during the 2001–2002 school year. The histogram on the left displays the ratios for the 24 states that are west of the Mississippi River, and the histogram on the right displays the ratios for the 26 states that are east of the Mississippi River.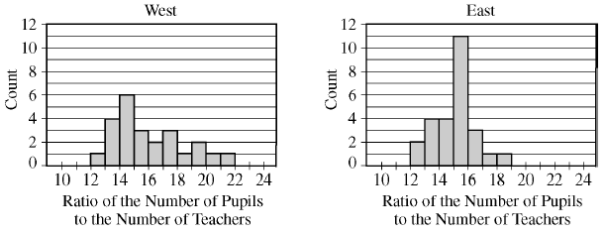
- Describe how you would use the histograms to estimate the median P-T ratio for each group (west and east) of states. Then use this procedure to estimate the median of the west group and the median of the east group.
- Write a few sentences comparing the distributions of P-T ratios for states in the two groups (west and east) during the 2001–2002 school year.
- Using your answers in parts (a) and (b), explain how you think the mean P-T ratio during the 2001–2002 school year will compare for the two groups (west and east).
Part B:
6) Grass buffer strips are grassy areas that are planted between bodies of water and agricultural fields. These strips are designed to filter out sediment, organic material, nutrients, and chemicals carried in runoff water. The figure below shows a cross-sectional view of a grass buffer strip that has been planted along the side of a stream.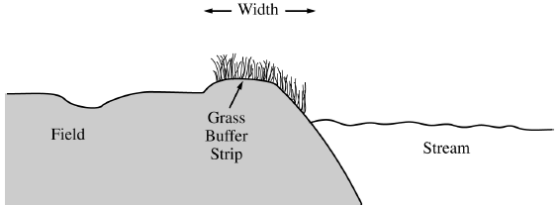
A study in Nebraska investigated the use of buffer strips of several widths between 5 feet and 15 feet. The study results indicated a linear relationship between the width of the grass strip (x), in feet, and the amount of nitrogen removed from the runoff water (y), in parts per hundred. The following model was estimated.

- Interpret the slope of the regression line in the context of this question.
- Would you be willing to use this model to predict the amount of nitrogen removed for grass buffer strips with widths between 0 feet and 30 feet? Explain why or why not.
A scientist in California wants to know if there is a similar relationship in her area. To investigate this, she will place a grass buffer strip between a field and a nearby stream at each of eight different locations and measure the amount of nitrogen that the grass buffer strip removes, in parts per hundred, from runoff water at each location. Each of the eight locations can accommodate a buffer strip between 6 feet and 13 feet in width. The scientist wants to investigate which combination of widths will provide the best estimate of the slope of the regression line.
完整版真題下載鏈接請注冊或登錄后查看
文件為PDF格式
推薦使用電腦下載
2011 AP Statistics統(tǒng)計學(xué) (Form B) FRQ簡答題完整版答案免費(fèi)下載
請持續(xù)關(guān)注,稍后更新
2011 AP Statistics Free-Response Questions Free Download
2011 AP統(tǒng)計學(xué)簡答題部分免費(fèi)下載
此套題僅Section II含有簡答題
共計1小時30分鐘,共6題
占總分50%
每道大題可能含有不同數(shù)量的小題
其中Part A建議用時1小時05分鐘,共5題,占Section II總分75%
Part B建議用時25分鐘,共1題,占Section II總分25%
可以使用圖形計算器
考試時會提供常用公式表
下載方式請訪問下方鏈接
翰林學(xué)員全站資料免費(fèi)打包下載,專享高速下載通道。
[vc_btn title="查看更多AP World History世界史課程相關(guān)詳情" color="primary" align="center" i_icon_fontawesome="fa fa-globe" css_animation="zoomIn" button_block="true" add_icon="true" link="url:http%3A%2F%2Fwww.linstitute.net%2Farchives%2F25886||target:%20_blank|"]
以上就是關(guān)于【2011 AP Statistics統(tǒng)計學(xué)真題系列(Form B)之簡答題免費(fèi)下載】的解答,如需了解學(xué)校/賽事/課程動態(tài),可至翰林教育官網(wǎng)獲取更多信息。
往期文章閱讀推薦:
新賽季AP如何“彎道超車”?拒絕無效內(nèi)卷!AP科學(xué)選課指南來了!
CB官宣重磅新規(guī)!2027年AP考試開考時間新規(guī)解讀+大考日程發(fā)布!大陸報名搶位開啟行動,翰林3大考點(diǎn)幫你提前鎖位!


翰林AMC8視頻課重磅上線!

國際競賽真題資源免費(fèi)領(lǐng)取






